High Power Busbar
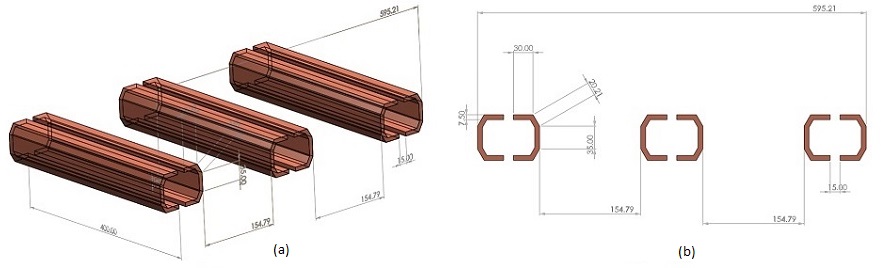
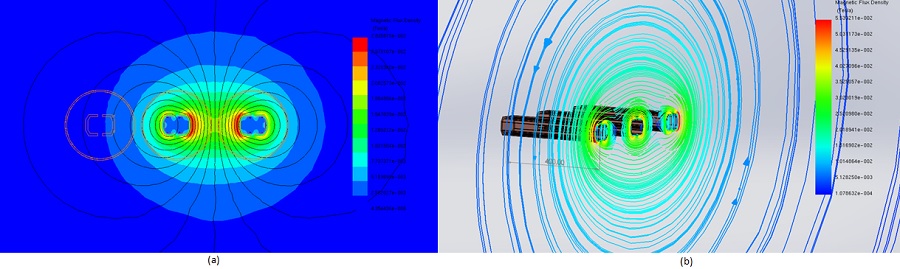
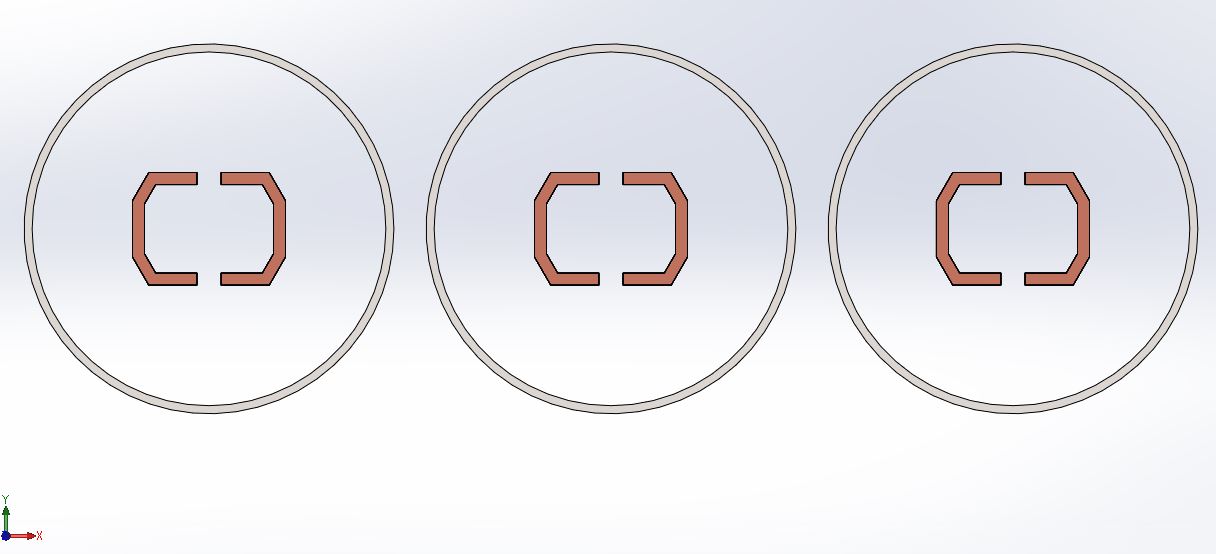
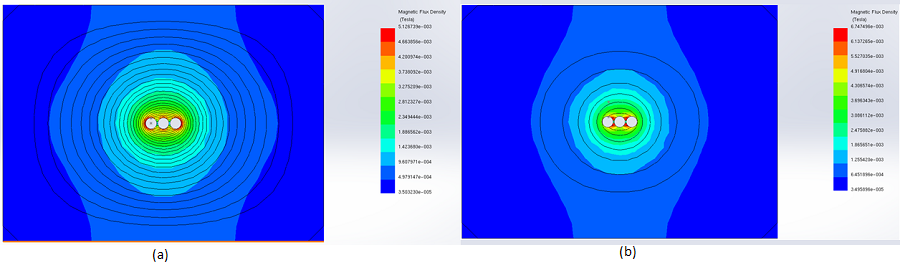
This application involves analyzing high-power busbars using EMWorks2D. Transient electromagnetic simulations compute various parameters like magnetic field, eddy currents, and electromagnetic losses. The analysis also evaluates physical phenomena such as proximity, skin effects, and shielding. Figures 1a) and 1b) depict the full 3D model and a simplified 2D model, respectively. EMWorks2D's 2D simplification feature automatically converts the initial 3D geometry into simulation-ready 2D surfaces. The simulated busbars operate at 3kA and 50Hz.
Transient magnetic simulation
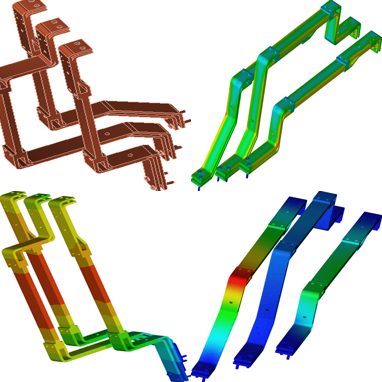
In this section, transient magnetic analysis is conducted to compute various electromagnetic parameters such as magnetic field, eddy currents, proximity effects, and electromagnetic losses. Figures 2a) and 2b) illustrate fringe and lines plots, respectively, showing the magnetic flux distribution in the busbars model at different time steps. Additionally, Figure 3 displays an animation of the field plot versus time spanning two electrical cycles.
Utilizing the parametric sweep feature of EMWorks2D, the input currents of the busbars are systematically varied, and the resulting magnetic field is analyzed along an axis in the XY plane. Figure 4 demonstrates that despite varying input currents, the magnetic field exhibits consistent behavior, characterized by several peaks around the busbar's conductors.
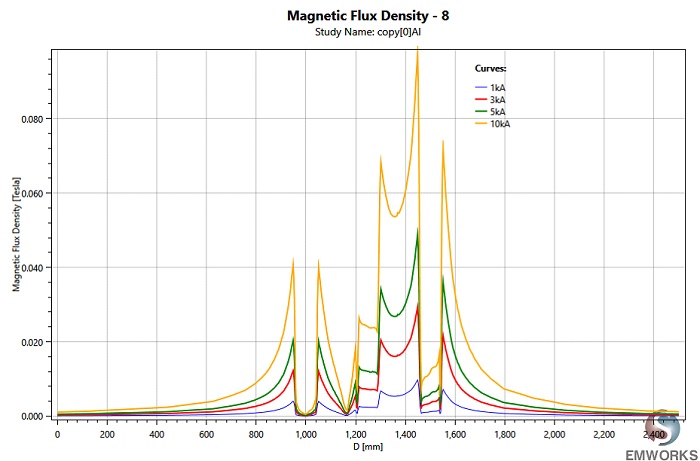
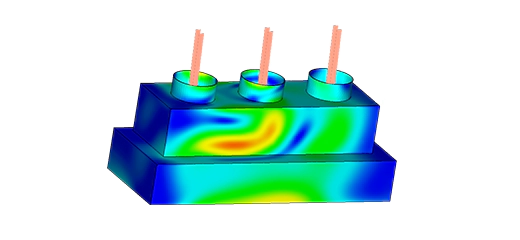
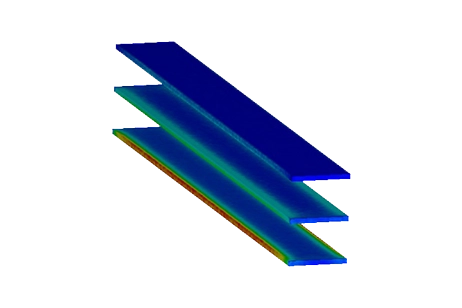
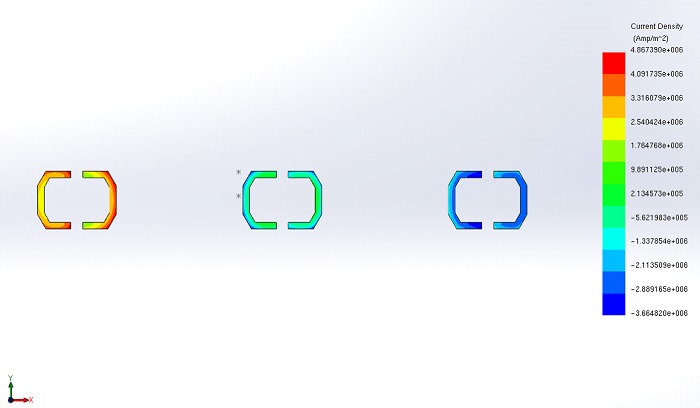
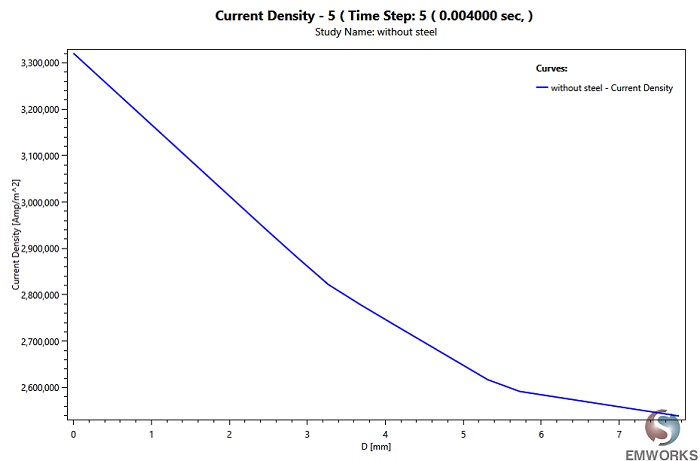
Figure 5 illustrates the current density distribution of the busbars model phases. Unlike static simulations, transient simulations involve time-varying applied currents, revealing various physical phenomena such as skin and proximity effects. As depicted in Figure 5, the current distribution is non-uniform due to these phenomena. Furthermore, Figure 6 displays the current density through one busbar's conductor wall, showcasing a decrease from one side to another.
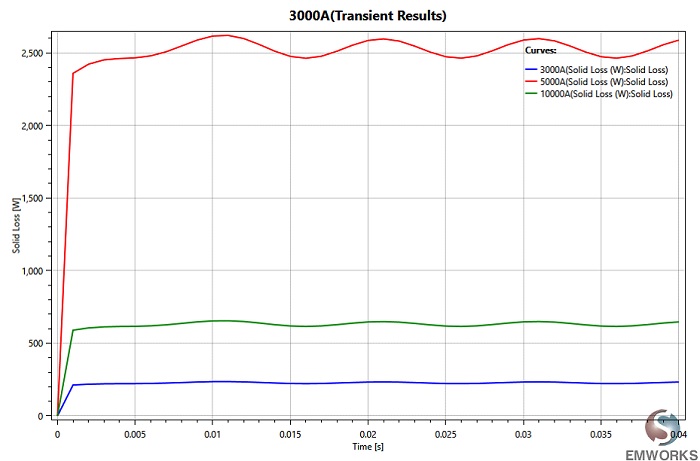
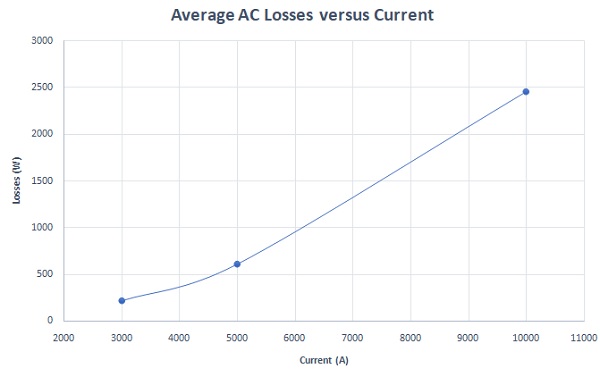
The total electromagnetic losses of the busbar model are computed across different input currents, as depicted in Figure 7. These losses exhibit a linear increase with the supplied current, as summarized in Figure 8.
Investigating the electromagnetic losses for both copper and aluminum materials is essential, as busbars are typically fabricated from these metals. Figure 9 presents the electromagnetic losses of the studied busbars for both copper and aluminum materials. It's observed that aluminum exhibits higher losses compared to copper, attributed to its higher electrical resistivity. However, this does not imply that copper busbars are superior overall, as aluminum offers advantages in terms of weight and cost ratio compared to copper.
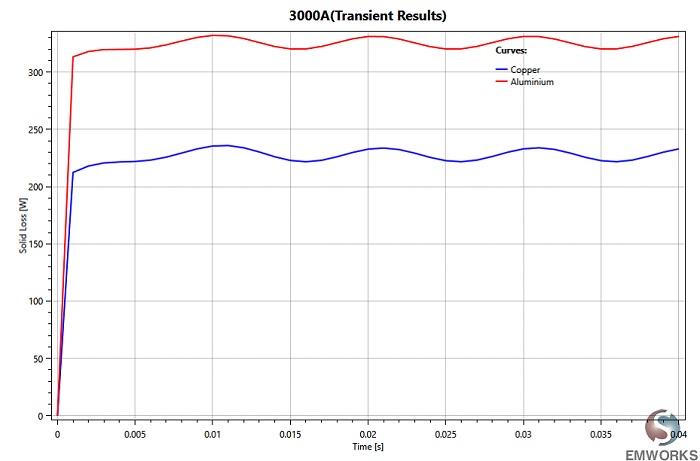
Figure 10 displays the total losses of the busbars model over time at different frequencies. It's noted that the average losses are highest at 1 kHz (~740W) and lowest at 50 Hz (~225W), as depicted in Figure 11. This indicates that electromagnetic losses increase with frequency, attributed to the skin effect. The skin depth, resulting from this phenomenon, decreases with frequency, leading to higher busbar resistances and losses. Additionally, Figure 12 illustrates the ratio of AC/DC losses versus frequency. This ratio becomes more significant at higher frequencies, increasing from 1.09 at 50 Hz to 3.6 at 1 kHz.
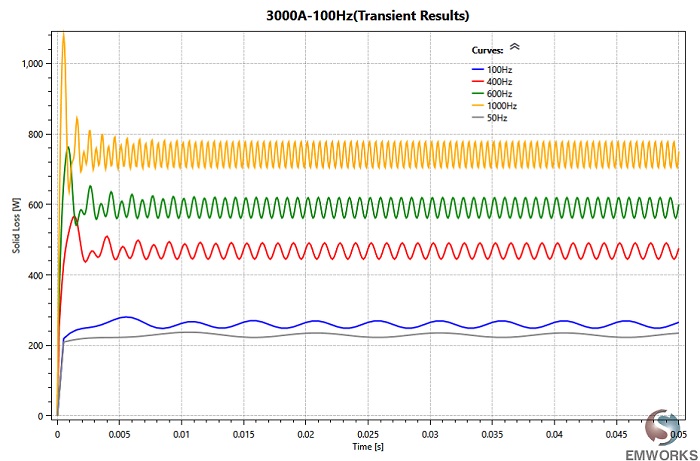
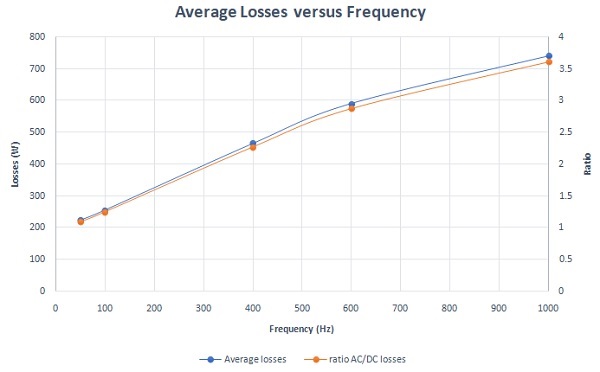
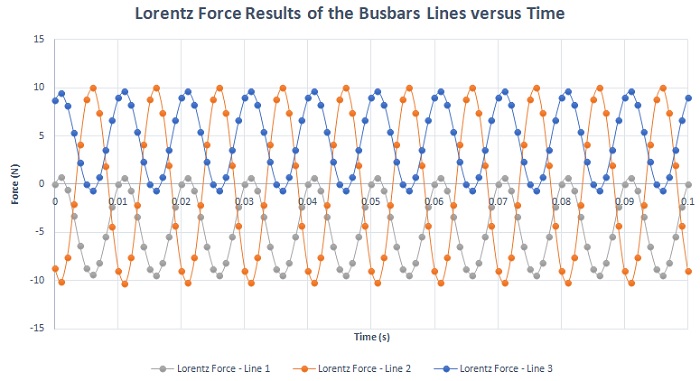
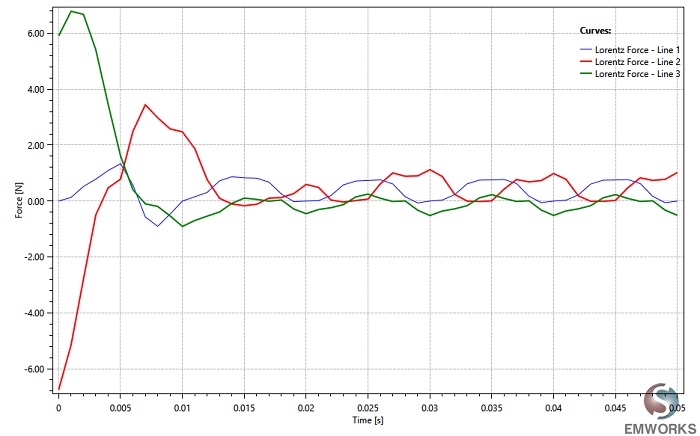
Figure 12 presents the x-components of the Lorentz force for different phases plotted against time, with the applied current being a 3 kA peak. It's evident that the average Lorentz force of phase 2 is nearly negligible, whereas the total average force across all phases amounts to approximately 4.5 N.
Shielding Effects
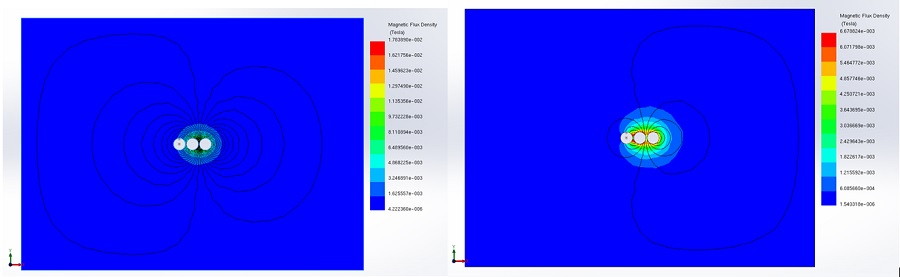
Figures 14 and 15 provide a comparison of static and time-varying magnetic fields with and without metallic shielding. In both scenarios, unlike unshielded busbars, the magnetic field distribution is significantly reduced in magnitude and confined to a smaller area around the busbars when steel shielding is incorporated.
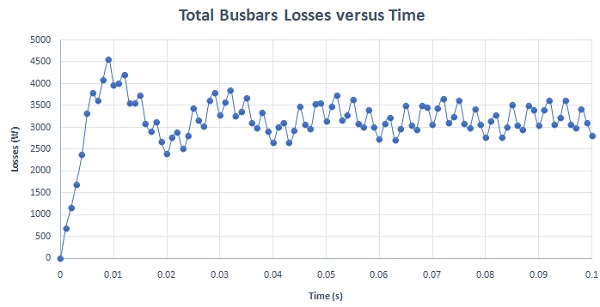
While shielding offers protection for electronic components and human health against electromagnetic radiation, it also introduces additional power loss. The figure below illustrates the total busbar losses when surrounded by metallic shielding.
Below are the Lorentz force results for the three busbar lines with metallic shielding. Overall, the average forces are less than 1N compared to 4.5N for unshielded busbars. Therefore, steel shielding can significantly reduce the impact of magnetic forces, especially in the event of a short circuit.
Short Circuit Response
Figure 18 provides a comparison of Lorentz force results in the third phase of the busbars. This comparison illustrates that the Lorentz force is reduced in the presence of metallic shielding.
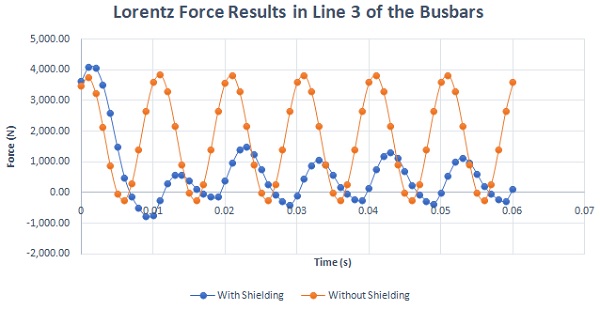
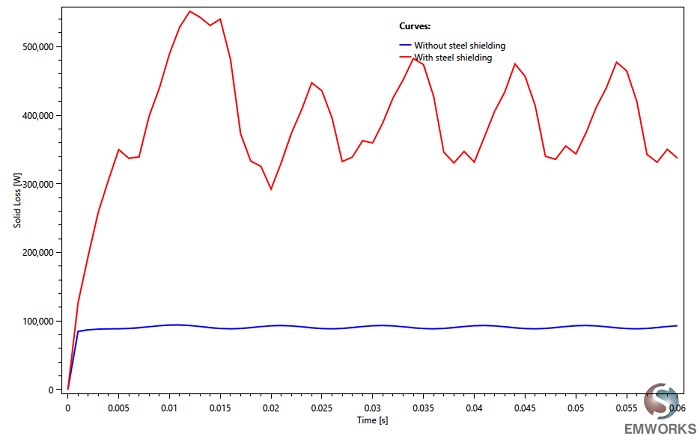
Figure 19 depicts the electromagnetic losses under short circuit conditions for both shielded and unshielded busbar models. These losses are notably substantial and could potentially lead to system damage.
Conclusion
The application note explores the analysis of high-power busbars using EMWorks2D, focusing on transient electromagnetic simulations to assess various parameters like magnetic field, eddy currents, and electromagnetic losses. Through detailed examination, the study evaluates physical phenomena such as proximity effects, skin effects, and shielding. Results depict consistent magnetic field behavior despite varying input currents and non-uniform current distribution due to transient simulations. Additionally, the study highlights the importance of investigating electromagnetic losses for different materials, noting higher losses in aluminum compared to copper due to its higher electrical resistivity. Frequency-dependent losses are also discussed, emphasizing the increase in losses with higher frequencies attributed to the skin effect. Incorporating metallic shielding demonstrates a significant reduction in magnetic field distribution, offering protection against electromagnetic radiation but introducing additional power loss. Lorentz force analysis showcases reduced forces with shielding, particularly beneficial during short circuit scenarios. Overall, the study provides comprehensive insights into the behavior of high-power busbars under various conditions, contributing to better understanding and optimization of power distribution systems.