Radio Frequency Identification
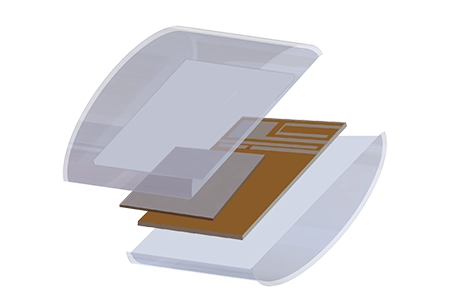
RFID (Radio Frequency Identification) is a versatile technology used for tracking and identification in various industries. It involves high-frequency data transfer between a tag and a reader. RFID tags, whether active or passive, consist of two key elements: an antenna for data transmission and reception, and an integrated circuit (IC) known as a transponder, responsible for data processing, storage, and signal modulation.
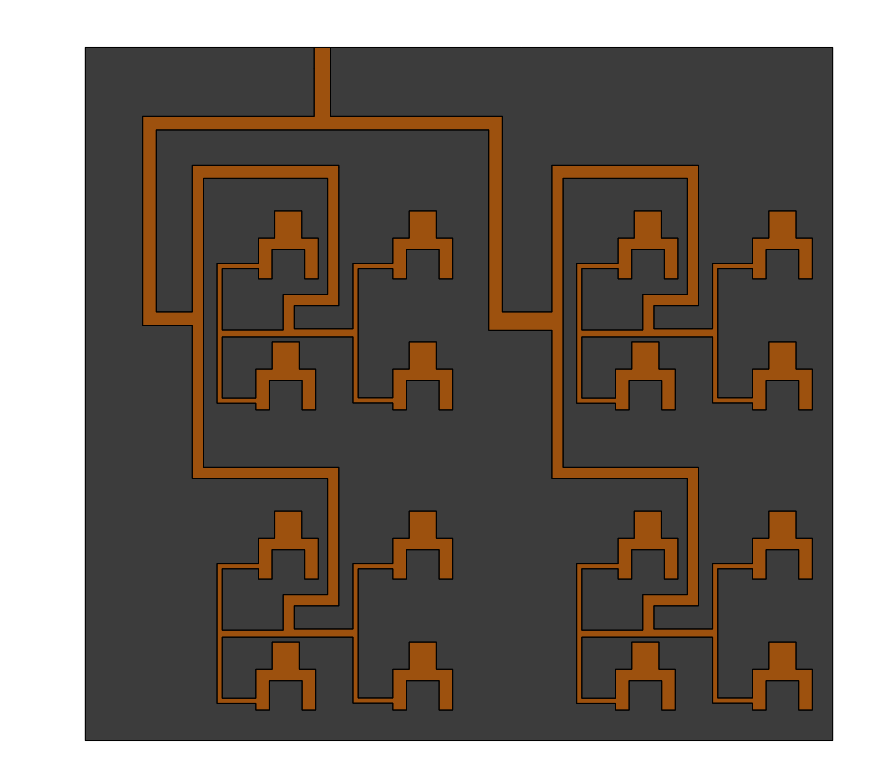
Here, we simulate an RFID tag antenna, specifically the one designed by LU et al. in a 2009 IEEE publication.
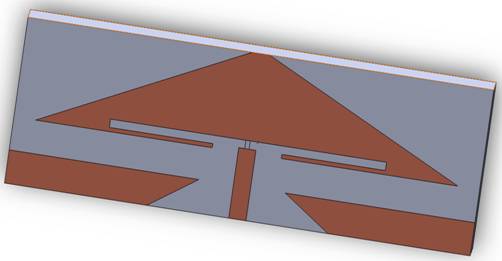
Figure 1 - RFID Tag Antenna
Simulation
LF (125 - 134.2 kHz and 140 - 148.5 kHz) and HF (13.56 MHz) RFID tags are globally usable without a license, while UHF (868 MHz-928 MHz) tags lack a common global standard.
![Frequency-ranges used for RFID-systems[1]](/media/images/product/large/6c8349cc7260ae62e3b1396831a8398f_2.jpg)
Figure 2 - Frequency ranges used for RFID systems [1]
As shown in the figure, RFID tags can operate in various frequency ranges. For this tutorial, we chose a frequency of approximately 2.45 GHz. We conducted an antenna study with a fast sweep frequency plan, covering 101 frequencies distributed between 2 and 3 GHz, centered around 2.5 GHz. In the next step, we performed a single-point individual simulation at 2.45 GHz to plot radiation patterns.
Load/ Restraint
The antenna is constructed using a Duroid 6006 substrate, and the printed layer is configured with a PEC (Perfect Electric Conductor) boundary condition.
Result
At the user-defined center frequency, you can visualize the electric and magnetic fields using various settings, such as isosurfaces, section clipping, animations by varying the omega-T phase, and color adjustments to highlight relevant intensities. Here is a capture of an electric field distribution observed on the surface of the antenna's board.
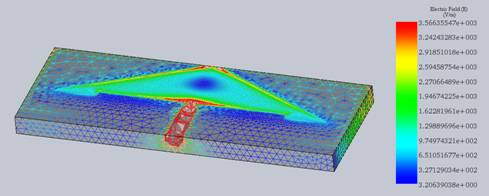
Figure 3 - 3D view of Electric Field Distribution
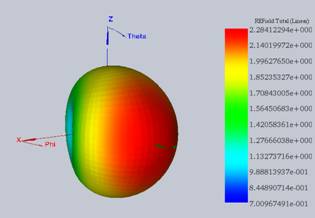
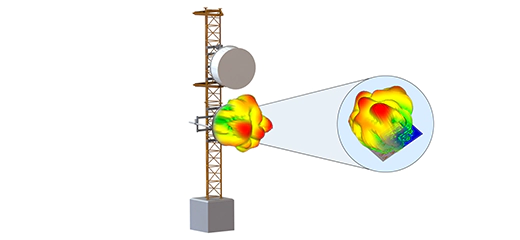
Figure 3 - Radiation pattern of the antenna
For antenna studies, it is essential to determine the best matching frequency at the input port. In the case of this RFID tag antenna, we achieve a return loss of better than 20 dB at 2.45 GHz, which is ideal for the intended application.
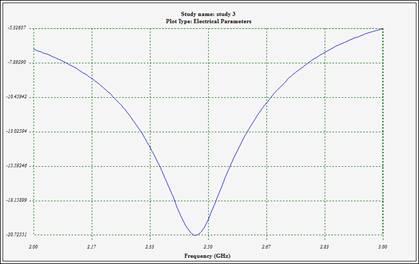
Figure 4 - Reflection coefficient at the antenna's port
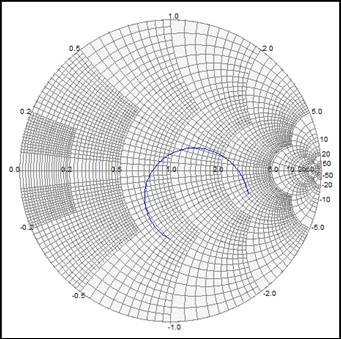
Figure 5 - Return Loss of the filter within various configurations
The reflection coefficient can also be plotted on a Smith Chart, and a marker is available for tracking the curve and discovering the optimal frequency for each point.
Conclusion
This application note delves into the simulation of an RFID tag antenna, leveraging the design by LU et al. from a 2009 IEEE publication. It highlights the versatility of RFID technology across various frequency ranges, including LF, HF, and UHF, focusing on a specific simulation around the 2.45 GHz frequency. Utilizing a Duroid 6006 substrate for the antenna construction and conducting a thorough antenna study across 101 frequencies between 2 and 3 GHz, the study zeroes in on 2.45 GHz for detailed radiation pattern analysis. The results, including electric and magnetic field visualizations and radiation patterns, demonstrate the antenna's effective performance with a return loss of better than 20 dB at the centered frequency, indicating optimal functioning for RFID applications. This simulation not only underscores the critical role of antenna design in RFID technology but also showcases the precise methodologies for evaluating antenna performance, offering valuable insights into RFID tag antenna development.
References
[1] RFIDEA: Engineering & Applications in electronic traceability