A Printed Monopole Antenna
Printed circular monopole antennas, known for their low-profile and ease of fabrication, face bandwidth limitations. This study compares simulated performances of such an antenna with published results, focusing on a substrate-backed design with a ground plane and a printed patch. By incorporating radiation boundaries to simulate an anechoic chamber and using symmetry boundary conditions, the study efficiently reduces mesh elements and simulation time, offering insights into optimizing these increasingly popular antennas.

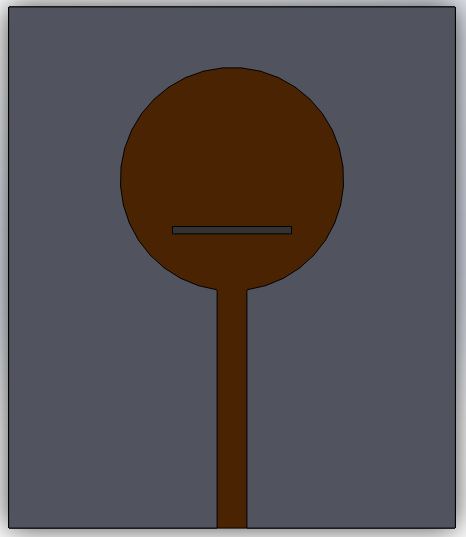
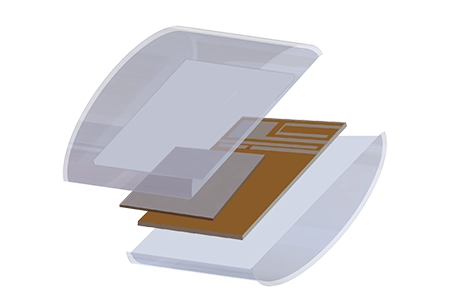
Figure 1 - Circular Disc Monopole Antenna (3D SolidWorks view)
Simulation
To efficiently simulate this antenna's behavior across its operating frequency range, a specialized "fast sweep" method is utilized in HFWorks. This technique significantly cuts down simulation time by generating a reduced-order model from the matrix equations at a single frequency, which then approximates solutions for nearby frequencies. HFWorks enhances this with an "adaptive fast sweep," automatically adjusting based on error thresholds and requiring only the maximum number of expansion points from the user, streamlining the simulation process.
Solids and Materials
Figure 1 showcases the antenna's discretized model, highlighting the substrate flanked by two printed planes: the ground and the patch. The model also includes air, truncated at a minimum distance of twice the wavelength to simulate the antenna's environment accurately.
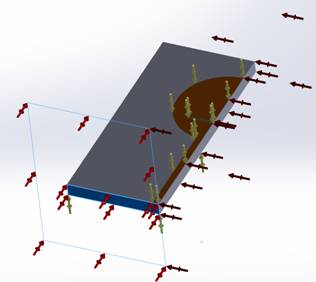
Figure 2 - Boundary conditions of the antenna
The figure illustrates various boundary conditions applied to the antenna model. Symmetric Perfect Electric Conductor (PEC) boundaries are shown with yellow arrows indicating the printed conductors. Red arrows highlight the port location, and Perfect Magnetic Conductor (PMC) symmetry surfaces are indicated on the right side. Radiation boundaries are applied to the air box's outer faces to accurately model electromagnetic field behavior.
Meshing
The mesh is deliberately finer on the ports and PEC faces, allowing the solver to enhance precision in capturing intricate details and shapes in these areas, ensuring accurate simulation results, particularly in regions with complex electromagnetic behavior.
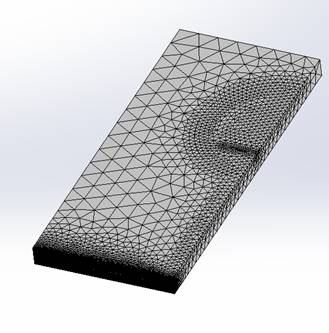
Figure 3 - Mesh of the half DR filter
Indeed, achieving accuracy in simulations often involves striking a balance between precision and time consumption. Excessive mesh refinement can lead to significantly longer simulation times, so it's important to find a suitable level of detail that provides accurate results while keeping the computational time within reasonable limits. This compromise is crucial in optimizing simulation efficiency.
Results
In antenna simulations, HFWorks offers a range of 3D and 2D plots, including Smith Charts, to visualize electrical parameters. In this case, plotting the radiation intensity at the optimal matching frequency, 5.5 GHz, along with the reflection coefficient is a straightforward task. The antenna achieves its best match at this frequency, boasting an impressive return loss of 27 dB, which is indicative of excellent impedance matching.
.JPG)
Figure 4 - Variations of return loss (S11)
The 3D plots available in antenna studies offer a diverse range of parameters to explore. Users can visualize the electric field distribution, its components in various coordinate systems, and antenna-specific parameters like radiation and directivity. These plots provide comprehensive insights into the antenna's performance and behavior, facilitating in-depth analysis and optimization.
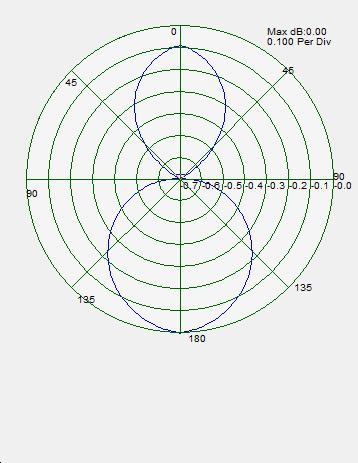
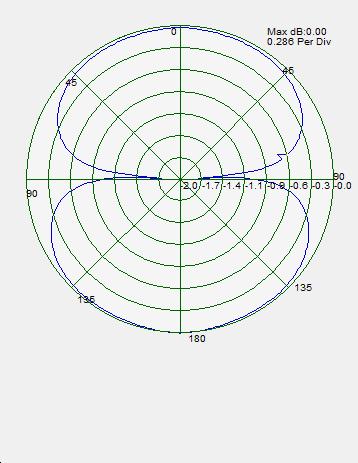
Figure 5 - Radiation pattern at 4 GHz and at 6.5 GHz
The figure depicts the radiation pattern, specifically the radiated electric field, on the Phi=90° plane for both frequencies. This visualization offers a detailed view of how the antenna radiates electromagnetic waves at these specific angles, aiding in understanding its directional characteristics.
Conclusion
This application note investigates the simulation and performance optimization of a printed circular monopole antenna, a design praised for its low-profile and manufacturing simplicity yet traditionally challenged by bandwidth constraints. Leveraging HFWorks for a detailed comparison with existing studies, this research focuses on a substrate-backed model featuring a ground plane and printed patch. It introduces efficient simulation strategies, such as the use of radiation and symmetry boundary conditions, to mimic an anechoic chamber environment and reduce computational demands. The "fast sweep" and "adaptive fast sweep" methods further streamline the process, enabling rapid analysis across the antenna's frequency range while maintaining accuracy. Key findings reveal the antenna's exceptional impedance matching at the optimal frequency of 5.5 GHz, highlighted by a return loss of 27 dB. Through careful mesh optimization and the application of advanced simulation techniques, this study underscores the potential of printed circular monopole antennas for broadband applications, offering valuable insights for enhancing their design and performance.
References
A Novel Disc Monopole Antenna for UWB Applications Mohamed Nabil Srifi, O.El-Mrabet, and Mohamed Essaaidi - Electronics and Microwaves Group, faculty of science, Abdelmalek Essaadi university, Tetuan 93000, Morocco