A Cylindrical Cavity
Resonance is a ubiquitous phenomenon present in nearly every facet of physics. It underpins the functionality of essential technologies like radio, television, music, and even the joy of playground swings. However, resonance also harbors a downside, occasionally leading to unwanted consequences such as bridge collapses or helicopter malfunctions. In the realm of HFWorks studies, the resonance of utmost relevance is electromagnetic resonance.
HFWorks employs an EM matrix to characterize a structure's natural modes of vibration, and these modes can be mathematically determined. This is precisely what the Eigenmode solver accomplishes—it identifies the frequency at which a structure can resonate. When considering losses like finite conductivity or dielectric loss, resonance is attenuated, allowing the calculation of a quality factor by relating stored energy to energy dissipation per cycle [1].
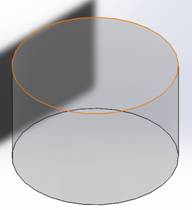
Figure 1 - Cylindrical cavity
Simulation
In line with our Resonance study, users have the flexibility to specify the number of modes, which in turn determines the number of resonance frequencies to be analyzed. By selecting the "lowest frequency guess" check-box, the analysis focuses solely on the lower end of the user-defined frequency range, as typically the number of modes is infinite.
Resonance analysis serves a multitude of applications, including the design of filters, oscillators, tuning elements, and more. These simulations primarily involve modal solutions of the electric field, delving into their distributions for each resonant frequency, and providing insights into resonant frequencies, Q-factors, and electric field distributions.
Solids and Materials Loads/ Restraints
In this particular example, we focus on a cylindrical cavity, where the boundaries are currently assigned a Perfect Electric Conductor (PEC) boundary condition. However, for a more realistic representation, an Imperfect Electric Conductor (IEC) boundary condition with dielectric losses could be assigned. This adjustment would enable the computation of Q factors, providing a more accurate simulation. Inside the cylinder, the space is filled with air, and the solver's task is to identify the frequencies at which the structure resonates.
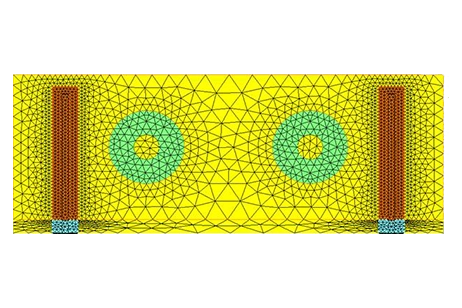
Meshing
Meshing operations are conducted on the three faces of the cylindrical structure, and it is crucial to ensure that the mesh resolution is sufficiently accurate to account for the cylindrical shape of the object. Users have the flexibility to adjust the global mesh size, striking a balance between the precision of simulation results and the computational time required for the analysis.
Results
The output results encompass various aspects of the electric field distribution, including magnitude, orientation, and fringe-like surfaces. These results are conveniently visualized within HFWorks, offering a comprehensive view of the electromagnetic behavior. Furthermore, users can seamlessly incorporate these plots into reports generated by HFWorks, available in both HTML and Word Document formats, facilitating efficient documentation and analysis.
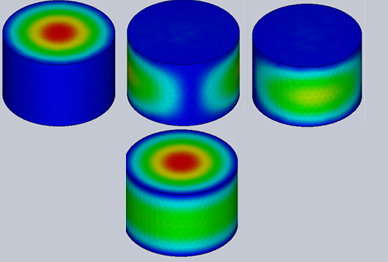
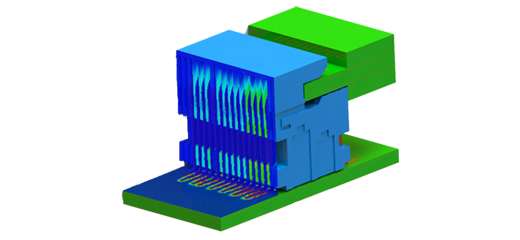
Figure 2 - Electric field's fringes for the different modes (from 1 to 4)
HFWorks provides users with the capability to generate plots depicting the electric and magnetic fields for each mode within the structure. This is achieved through the use of the section clipping feature, enabling a detailed and insightful analysis of field distributions across various resonance modes.
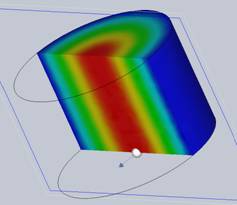
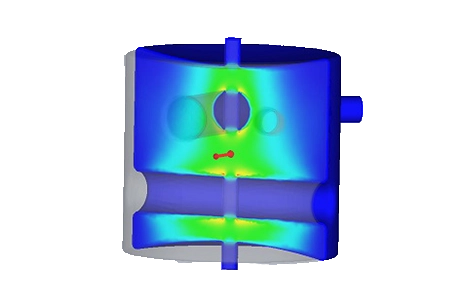
Figure 3 - Electric field distribution with the section clipping feature
In contrast to the idealized scenario presented earlier, for a more realistic simulation, we can modify the model by replacing the Perfect Electric Conductor (PEC) boundary condition with an Imperfect Electric Conductor (IEC). This allows for the customization of conductivity and roughness values, introducing a level of imperfection into the model. Additionally, dielectric loss can be incorporated to further enhance realism.
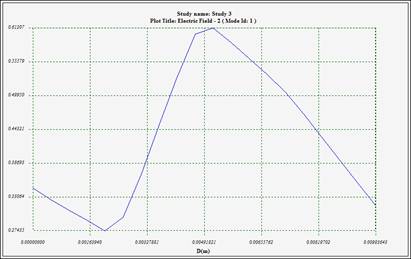
Furthermore, HFWorks enables the selection of a specific segment between two predefined points within SolidWorks, facilitating the plotting of the electric field distribution between these points. The resulting distance measurement will be displayed in the default unit, enhancing precision and accuracy in the analysis.
Concerning the Q factor, its physical significance is reflected in this formula:
![]()
HFWorks employs quality factor calculations for each mode, providing valuable insights into the energetic performance of the system. The figure below illustrates the essential parameters associated with each resonance mode, enabling users to assess and evaluate the system's performance and efficiency.
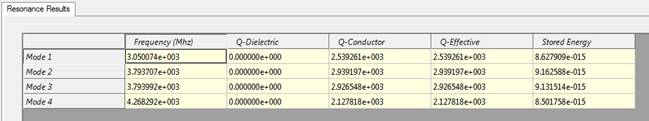
HFWorks offers the flexibility to export tables to various file formats, expanding the utility of the output data for use in other simulations within different programs. Users can choose from a selection of file extensions, including Text, Touchstone, Excel Sheets, Circuit Simulator File, and Super Compact Data, ensuring compatibility and seamless integration with external tools and software.
Conclusion
The application note underscores the critical role of resonance, particularly electromagnetic resonance, in both beneficial technologies and scenarios where it might pose risks. HFWorks leverages an electromagnetic matrix to pinpoint natural vibrational modes, utilizing the Eigenmode solver to identify potential resonant frequencies. This tool is vital for applications such as filter design, oscillators, and tuning elements, focusing on modal solutions of the electric field to explore resonant frequencies, Q-factors, and field distributions. The study highlights the use of Perfect Electric Conductor (PEC) and Imperfect Electric Conductor (IEC) boundary conditions to simulate realistic scenarios, including dielectric losses to compute Q factors more accurately. Meshing accuracy is emphasized for precise simulations, and the results offer detailed visualizations of electric field distributions. HFWorks' ability to adapt simulations with customized conductivity, roughness values, and dielectric loss enhances realism, providing valuable insights into the energetic performance and efficiency of systems through quality factor calculations and detailed field distribution analysis.
References
[1 ] “Coupled Resonator Filter Realization by 3D-EM Analysis and Space Mapping”, IEEE MTT IMS-2002, Seattle USA, WMB Workshop
[2 ] Volume Mesh Generation and Finite Element Analysis of Trabecular Bone Magnetic Resonance images 2007 Ángel Alberich-Bayarri, David Moratal, Luis Martí-Bonmatí, Manuel Salmerón-Sánchez, Ana Vallés-Lluch, Laura Nieto-Charques, José J. Rieta, Member, IEEE
[3 ] Eigenmode Analysis of Boundary Conditions for the One-Dimensional Preconditioned Euler Equations David L. Darmofal, Pierre Moinier, Michael B. Giles§