A Dielectric Resonator Filter
A symmetric dielectric resonator filter model [1] undergoes analysis using HFWorks' Scattering Parameters module. This analysis aims to ascertain its pass-band characteristics, attenuation within and outside the band, and electric field distributions across different frequencies. The results closely align with those presented in [2].
These cables feature a lossy conductor and Teflon interior. HFWorks offers the capability to generate 2D plots, and Smith Chart plots, and visualize electric fields in vector and fringe 3D plots for all frequencies under examination.
Before diving into Scattering Parameters, it's advisable to conduct a resonance study to ensure the model's dimensions align with the desired frequency, specifically the desired resonance mode.
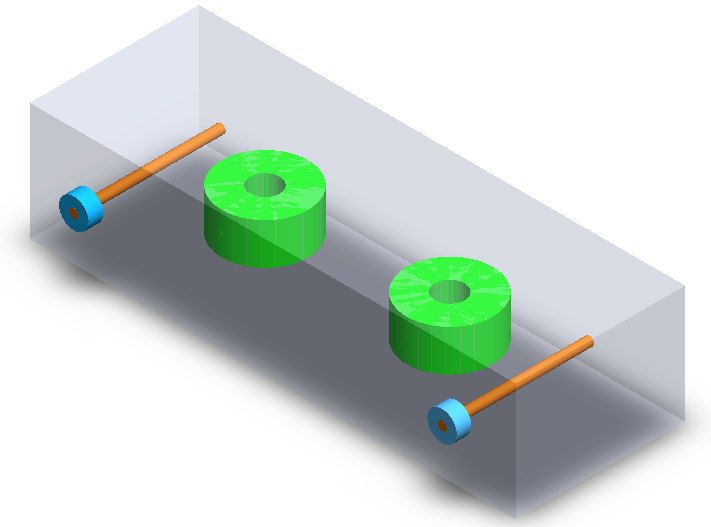
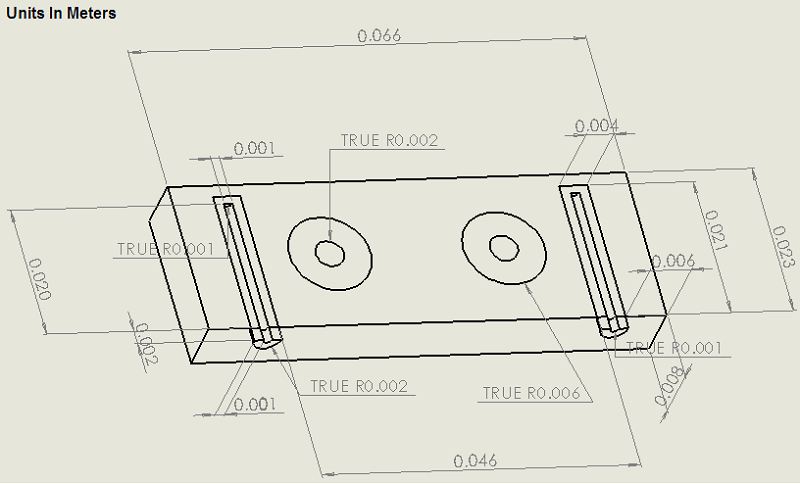
Figure 1 - Half-wave DR filter (3D SolidWorks view)
Simulation
To simulate the filter's behavior, including insertion and return loss, we will set up a Scattering Parameters study. This study will specify the frequency range for analysis, covering 100 frequencies uniformly distributed from 4 GHz to 8 GHz, which corresponds to the antenna's operational range.
Solids and Materials
Figure 1 illustrates the discretized model of a dielectric circuit filter featuring coaxial input and output couplers. The two dielectric discs function as coupled resonators, transforming the entire device into a high-quality bandpass filter.
Load/ Restraint
Two ports are applied to the sides of the two coaxial couplers in the model. The bottom faces of the air box are designated as Perfect Electric Boundaries. Since the structure possesses horizontal symmetry, it is sufficient to model only one-half. To convey this to the HFWorks simulator, we apply a PEMS (Perfect Electric Magnetic Symmetry) boundary condition. The choice between PECS (Perfect Electric Conductor Symmetry) and PEMS depends on the orientation of the electric field near the symmetry boundary. If the electric field is tangential to the boundary, PEMS is applied; if it is orthogonal, then PECS is used.
Meshing
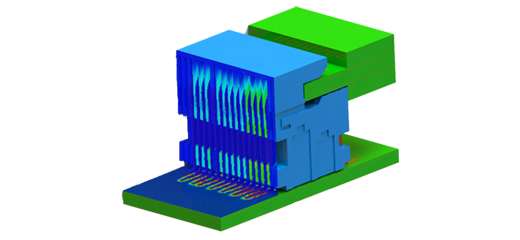
Concentrating the mesh on the ports and Perfect Electric Conductor (PEC) faces is crucial. This approach aids the solver in refining its precision on the intricate details of these areas, ensuring that their unique characteristics are accurately captured and considered during the simulation.
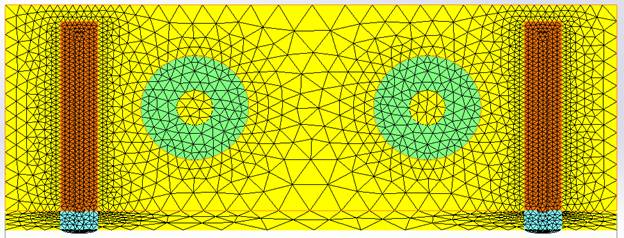
Figure 2 - Mesh of the half DR filter
Results
Various 3D and 2D plots are at your disposal, depending on the specific task and the parameter of interest. Given that we're dealing with a filter simulation, it's intuitive to focus on plotting the S21 parameter.
As mentioned earlier in this report, HFWorks allows for the visualization of electrical parameter curves in both 2D plots and Smith Charts. The latter is particularly useful for addressing matching concerns and is highly relevant in the context of filter designs. We observe sharp pass bands and exceptional isolation outside the designated frequency band.
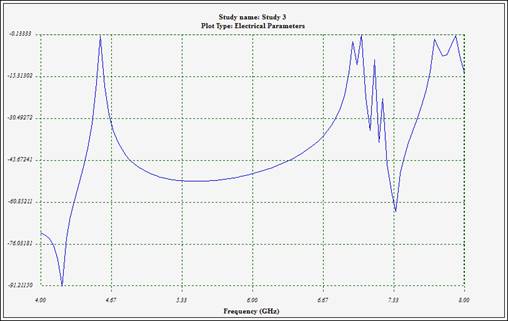
Figure 3 - Variations of insertion loss (S21)
![S21 as presented in the paper [1]](/ckfinder/userfiles/images/ccc.JPG)
Figure 4 - S21 as presented in the paper [1]
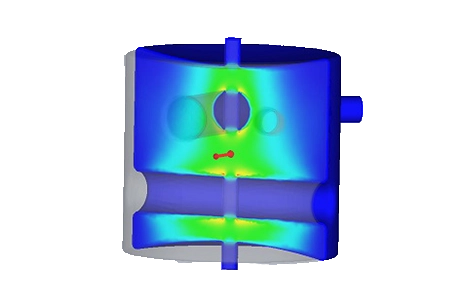
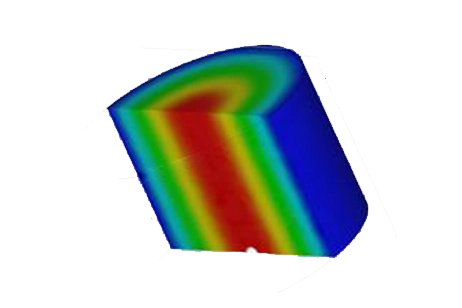
The 3D plots in the scattering-parameters studies offer a comprehensive range of parameters. The following two figures illustrate the electric field distribution for two frequencies, one within the band of interest and the other outside it. These visualizations provide valuable insights into the behavior of the filter across different frequency ranges.
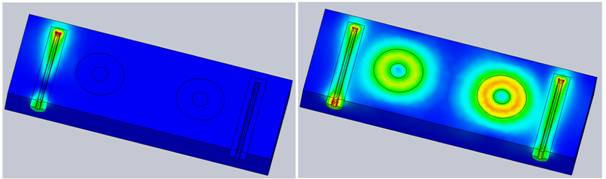
Figure 5 - Electric field vector distribution (at 4 GHz (left) and 4.56 GHz (right))
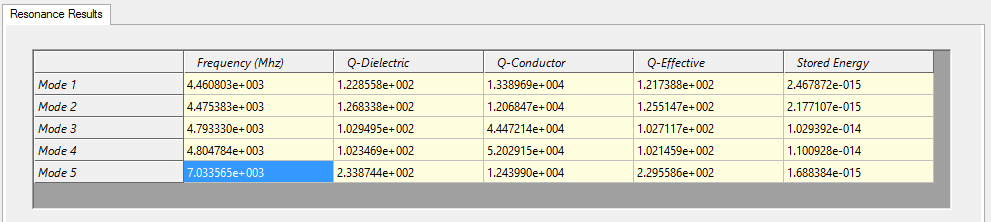
The model can also be simulated using HFWorks' resonance solver, which allows for the detection of numerous modes as needed. Setting up a resonance study is straightforward and can be derived from the S-Parameter simulation study with ease, thanks to HFWorks' user-friendly drag-and-drop operations. The resonance solver incorporates the model's electromagnetic matrix and provides various Eigenmode solutions. These results exhibit a strong correlation with the outcomes of previous studies. Below, we present the result table:
Conclusion
In conclusion, this application note thoroughly explores the analysis of a symmetric dielectric resonator filter using HFWorks' Scattering Parameters module. Through simulation, the pass-band characteristics, attenuation, and electric field distributions are accurately evaluated across different frequencies, aligning closely with referenced studies. The discretized model, featuring coaxial input and output couplers, facilitates an effective simulation setup. Boundary conditions, meshing strategies, and result visualization techniques contribute to the robustness of the analysis. By focusing on key parameters like insertion loss (S21) and electric field distribution, the performance of the filter is comprehensively assessed. Additionally, the resonance solver enables the detection of multiple modes, ensuring resonance study compatibility with S-parameter simulations. Overall, the results obtained demonstrate a strong correlation with established literature, validating the efficacy of the analysis approach.
References
[1] Microwave Filter Analysis Using a New 3-DFinite-Element Modal Frequency Method, John R. Brauer, Fellow, IEEE, and Gary C. Lizalek, Member, IEEE TRANSACTIONS ON MICROWAVE THEORY AND TECHNIQUES, VOL. 45, NO. 5, MAY 1997
[2] John R. Brauer, Fellow, IEEE, and Gary C. Lizalek, member, IEEE " Microwave Filter Analysis Using a New 3-D Finite-Element Modal Frequency Method."IEEE Transactions on Microwave Theory and Techniques, Vol45, No. 5, pp.810-818, May 1997.