NDT Eddy Current Techniques
Non-destructive testing (NDT), including eddy current testing and infrared thermography (IR), evaluates materials without causing damage. Eddy current testing induces magnetic currents to detect defects, while IR analyzes temperature variations. These techniques are vital in industries like aerospace and automotive.
Eddy current pulsed thermography ECPT
Active Infrared thermography, employing induction heating, is gaining prominence in non-destructive testing (NDT) for its reliability and precision in defect detection. Combining electromagnetic excitation and transient infrared thermography, this method heats samples with induced eddy currents and detects defects through thermal distribution disturbances captured by an IR camera. This technique offers wide applicability, high detection speed, and contactless inspection. This application note assesses the effectiveness of Electromagnetic-thermal NDT through Finite Element Method (FEM) analysis. The model comprises a spiral coil around a U-shaped ferrite core inspecting a defective structural steel workpiece. See Figure 1 for a schematic of the ECPT technique and the 3D design under study.
![a) Schematic illustration of the ECPT [1] b) 3D design of the studied model](/ckfinder/userfiles/images/a%29-Schematic-illustration-of-the-ECPT-%5B1%5D-b%29-3D-design-of-the-studied-model.jpg)
Problem Description
Utilizing the AC magnetic module of EMS coupled with the transient thermal solver, this analysis aims to compute and visualize the distribution of eddy currents and temperature around a specimen crack. A ferromagnetic core is employed to concentrate flux around the defect, ensuring uniform induction heating and facilitating open-view IR imaging for quantitative evaluation of cracks.
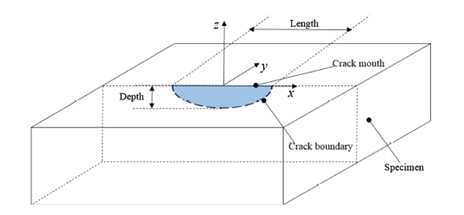
The figure below depicts the semi-elliptical crack shape, while Table 1 provides detailed dimensions of each component.
| Part | Dimensions | ||
| Coil | Turns: 3 | Main diameter: 25 mm | Wire diameter: 6.35 mm |
| Outer dimensions of the ferrite yoke | Length:58.5 mm | Width:43 mm | Height:27.5 mm |
| Inner dimensions of the ferrite yoke | Length:56.1 mm | Width:31 mm | Height:27.5 mm |
| Specimen | Length: 130 mm | Width: 65 mm | Height: 7.5 mm |
| Semi-elliptical crack | Length: 12 mm | Width: 0.6 mm | Depth: 2.4 mm |
| Gap between yoke and specimen | 1mm | ||
| Part | Material | Density (kg/$$ m^3 $$) | Magnetic permeability | Electrical conductivity (S/m) | Thermal conductivity (W/m.K) | Specific heat capacity (J/Kg.K) |
| Coil | Copper (Cu) | 8900 | 0.99 | 6 E+07 | 385 | 390 |
| Specimen | Structural steel | 7800 | 200 | 4.032 E+6 | 44.5 | 475 |
| Yoke | Ferrite | 4900 | 2300 | 0.15 | Not Required | |
Boundary conditions
1-Electromagnetic input
The copper inductor is modeled as a solid coil within the simulation. It supports a current input ranging from 55 A RMS with a frequency of 155 kHz.
2-Thermal input
Thermal convection is applied to the air surrounding the model, with an ambient temperature of 20°C. The heat transfer coefficient is set to 5 W/m²°C.
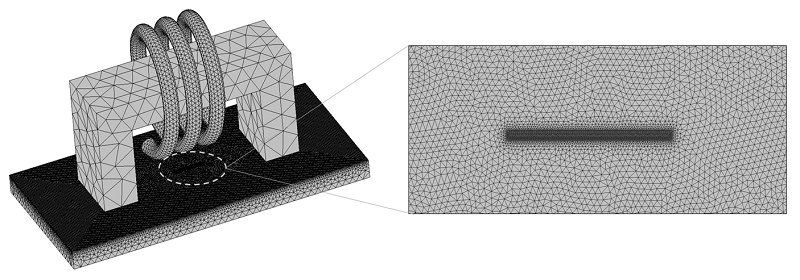
Mesh
A fine mesh was applied to the top surface of the specimen and to the crack using EMS's mesh control feature. This ensures accurate representation of the localized eddy currents across the skin depth of the tested plate.
Results
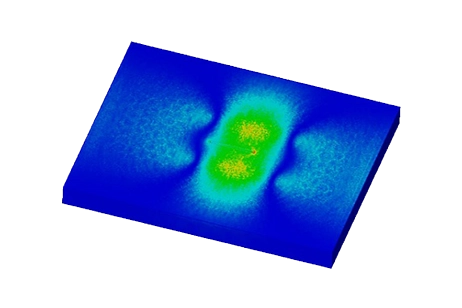
After 500 ms of induction heating, the simulation revealed significant findings. The current density distribution around the crack on the specimen surface displayed a clear perturbation of eddy currents, reaching maximum intensity around the endpoints of the detected defect. The altered flow directions of currents induced by the crack resulted in uneven heating of the surface.
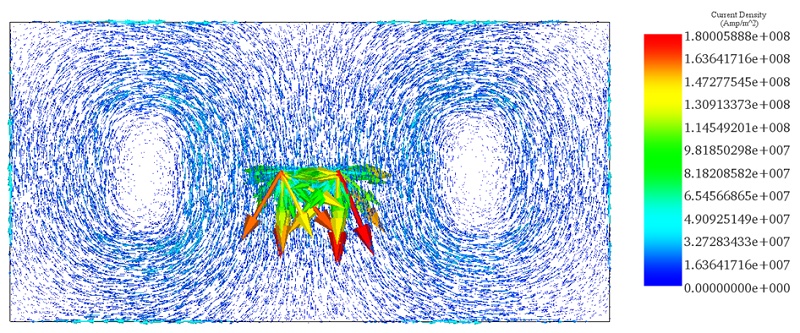
Figure 4 - Vector plot of current density distribution
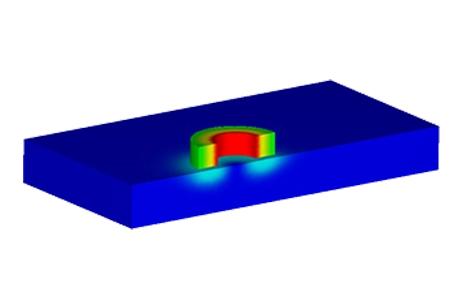
The induced temperature distribution is depicted in Figure 5. Across the central region of the U-shaped core on the specimen, the temperature appears to be evenly distributed. The maximum temperature is observed at the contours of the crack, reaching 23.13 °C, aligning well with the results reported in Reference [1].
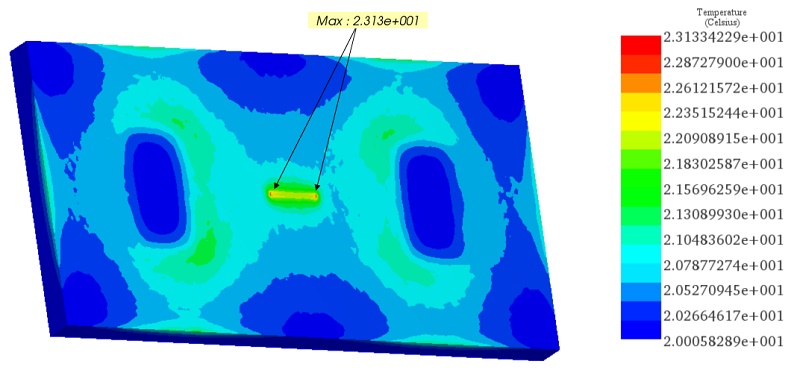
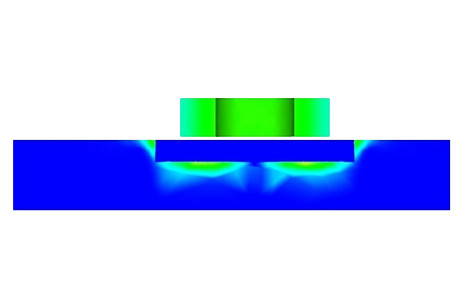
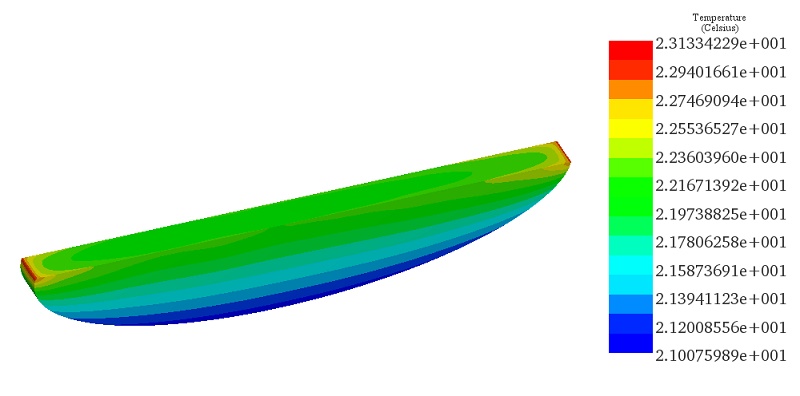
Figure 6 illustrates the region of heated air delimited by the crack. Noticeably, the temperature at the endpoints of the defect surpasses that of other areas, sharply declining in the depth direction. These distinct characteristics aid in predicting the crack length from the two peak temperature points at the edges and determining the temperature difference between the crack and other regions.
Conclusion
This application note underscores the efficacy of Electromagnetic-thermal Non-Destructive Testing (NDT), focusing on Eddy Current Pulsed Thermography (ECPT) as analyzed through EMWorks' Finite Element Method (FEM). The study meticulously simulates the distribution of eddy currents and temperature around a crack in a structural steel specimen, using a U-shaped ferrite core and copper coil for induction heating. Through careful analysis, perturbations in eddy currents around the defect were observed, with the highest temperatures concentrated at the crack's contours, indicative of uneven surface heating. The simulation not only captures these disturbances accurately but also aligns with referenced empirical data, showcasing the precision of electromagnetic-thermal NDT in identifying and characterizing defects.
References
[1]- He, Min, Laibin Zhang, Wenpei Zheng, and Yijing Feng. "Investigation on a new inducer of pulsed eddy current thermography." AIP Advances 6, no. 9 (2016): 095221.