Three Phase Busbars
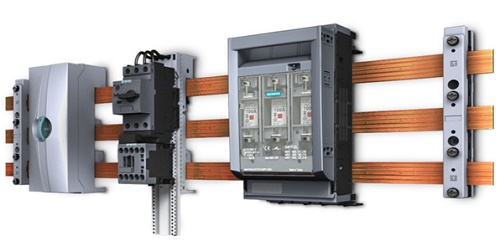
High-performance electrical installations rely on flexible and efficient power distribution. Busbar systems serve as essential connection points, linking high-voltage equipment in switchyards and low-voltage equipment in battery banks. Typically made of aluminum or copper, these systems minimize power loss during transmission. Constructed from flat rectangular bars arranged in parallel for each phase, they reduce thermal stresses and enhance the proximity effect, making them ideal for commercial and industrial buildings.
Problem description
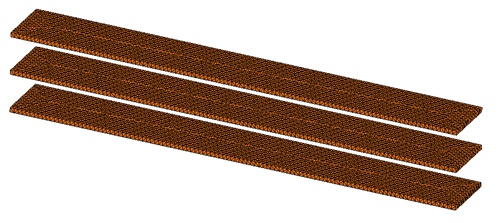
The rise in resistance of busbars, caused by the aligned arrangement carrying high current, stems from both skin and proximity effects. These effects increase thermal stresses, prompting an investigation into the thermal and mechanical behavior of a three-phase busbar system using EMS simulation. By coupling the AC magnetic module with structural and steady-state thermal analyses, the tool computes and visualizes temperature and deflection distribution for each phase. The busbar system comprises three phases, each with a single copper conductor separated by an equal isolation distance (D), as depicted in the figures below.
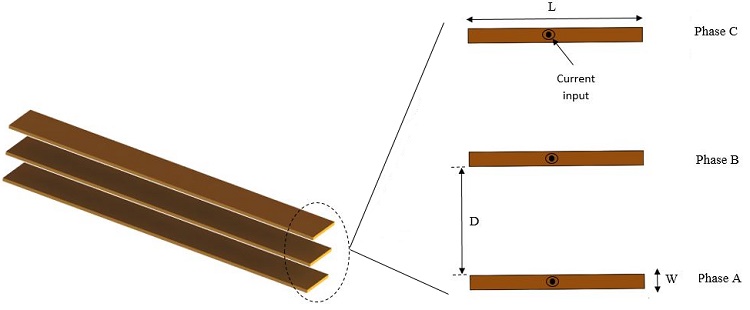
Table 1 defines the dimensions of each conductor.
| Parameter | Dimension (mm) |
| Width (W) | 10 |
| Length (L) | 120 |
| Thickness (T) | 1000 |
| Distance of isolation between phases (D) | 75 |
The studied busbar is made of Copper. The corresponding properties are detailed in Table 2.
| Part | Material | Density (Kg/m3) | Magnetic permeability | Electrical conductivity (S/m) | Thermal conductivity (W/m.K) | Specific heat capacity (J/Kg.K) | Elastic Modulus (Pa) | Poisson ratio |
| Conductor | Copper (Cu) | 8900 | 0.99 | 6 E+07 | 385 | 390 | 110E+9 | 0.37 |
Boundary conditions
1. Electromagnetic Input:
The inductor coils are modeled as solid coils supporting a maximum ampacity current of 1800 A RMS at a frequency of 50 Hz for the studied busbar. The cross-section dimensions are 3/8 in x 5 in, as referenced in [2].
2. Thermal Input:
Thermal convection is applied to the air surrounding the model at an ambient temperature of 25°C. The heat transfer coefficient is set to 6 W/m²°C.
3. Structural Boundary Conditions:
Fixed boundary conditions are applied to the faces corresponding to the Entry/Exit excitation ports.
Mesh
The entire model is uniformly meshed within EMS using a fine-controlled mesh, ensuring more accurate results.
Results
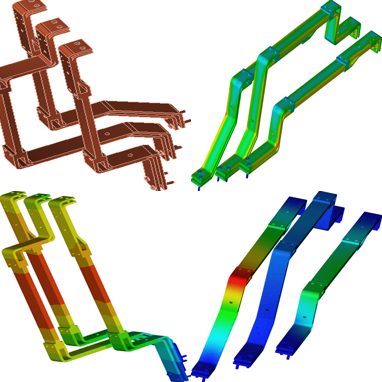
The Multiphysics simulation unveiled the following results. Figure 4 illustrates the current density distribution across each conductor for the phase, reaching a peak value of 3.83E+06 A/m² (RMS value 2.7E+06 A/m²), consistent with the findings in Reference [3]. An observable unbalanced current distribution among the three conductors is evident, attributed to the proximity effect and the 120° phase shift.
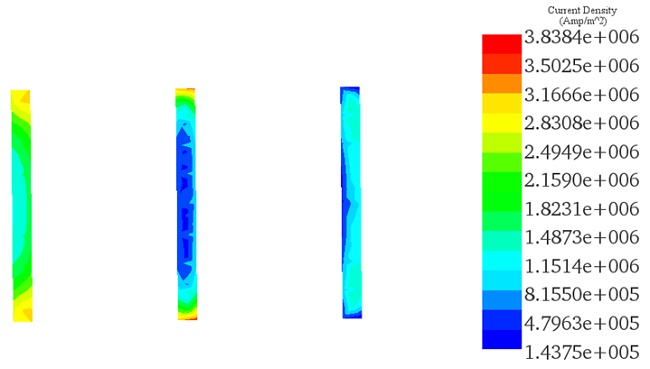
(a)
(b)
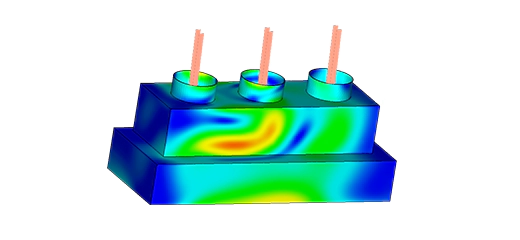
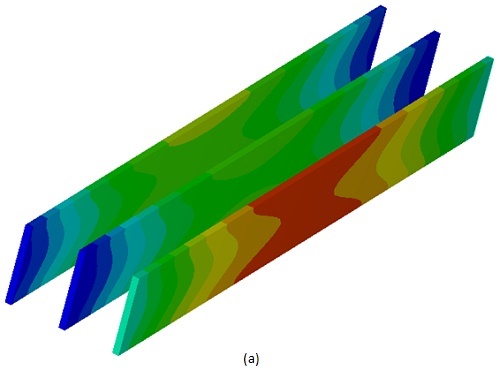
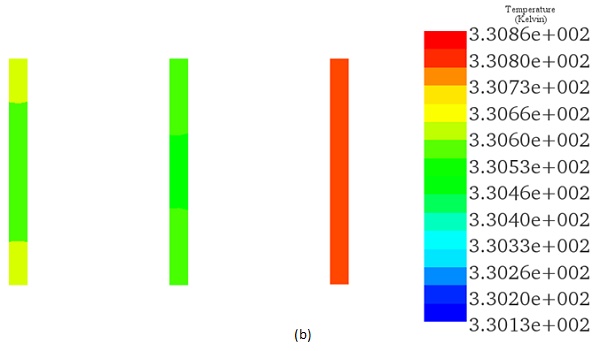
The achieved temperature resulting from induced current due to proximity and skin effects, coupled with dephasing, is depicted in Figure 5. It attains an average value of 330K for each conductor of the busbar system.
A comparison between EMS and Reference [3] results, regarding the busbar losses, shows a good coincidence for each single conductor.
| Conductor | A | B | C |
| Reference [3] losses results (W) | 51.58 | 51.22 | 51.24 |
| EMS losses results (W) | 51.55 | 51.2 | 51.29 |
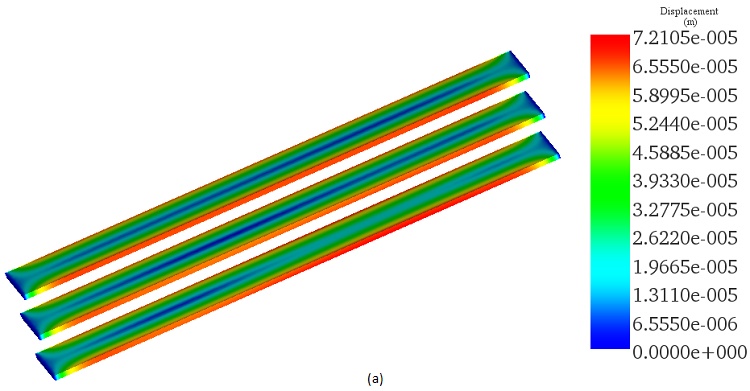
The mechanical displacement of the busbar conductors, induced by thermal stress under AC conditions, is assessed. Maximum displacement values are observed along the lateral faces of the conductors. See the figure below for a visualization of the resultant displacement plot across the busbar system.
(b)
Conclusion
This application note delves into the assessment of thermal and mechanical behaviors of a three-phase busbar system under high current conditions using EMS simulation. Through the integration of AC magnetic, structural, and steady-state thermal analyses, it visualizes temperature distribution and deflection across the system, crucial for evaluating the safety and efficiency of electrical installations.
The investigation focuses on a copper busbar system, structured with individual conductors for each phase, separated by an isolation distance to mitigate thermal stresses and proximity effects—key factors in maintaining system integrity and performance. The simulation process involves applying a high ampacity current, considering thermal convection, and imposing fixed structural boundaries to mimic real-world operational conditions.
Results from the multiphysics simulation highlight an unbalanced current distribution among the conductors due to the proximity effect and phase shifts, with current density and temperature distributions providing insight into potential areas of stress and inefficiency within the system. The comparison of EMS findings with referenced results confirms the simulation's accuracy in predicting busbar losses and mechanical displacements induced by thermal stresses.
References
[1]. http://www.directindustry.com/prod/siemens-low-voltage-products/product-25580-1704961.html
[2]. https://www.copper.org/applications/electrical/busbar/bus_table1.html
[3]- Popa, Ioan C., and Alin-Iulian Dolan. "Numerical modeling of three-phase busbar systems: Calculation of the thermal field and electrodynamic forces." Applied and Theoretical Electricity (ICATE), 2016 International Conference on. IEEE, 2016.