A Coaxial Cable
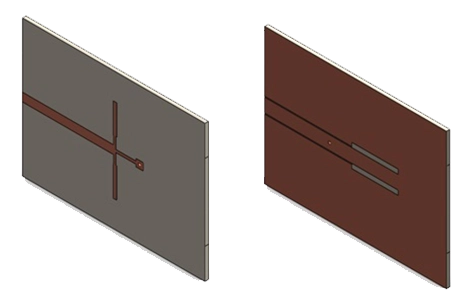
Analyze a coaxial cable featuring discontinuities (refer to Figure 1) using the Time-Domain Reflectometry (TDR) solution provided by the S-parameter module in HFWorks. This involves transmitting a pulse signal into the cable through the entry port and examining the resulting reflection at the other end of the cable. The cable model displayed comprises three sections with discrete transitions.
The TDR module effectively calculates the impedance along the pulse propagation path between the two ports. Consequently, the designer gains insights into the locations of reflections and can investigate their causes, drawing upon TDR expertise for further analysis.
.
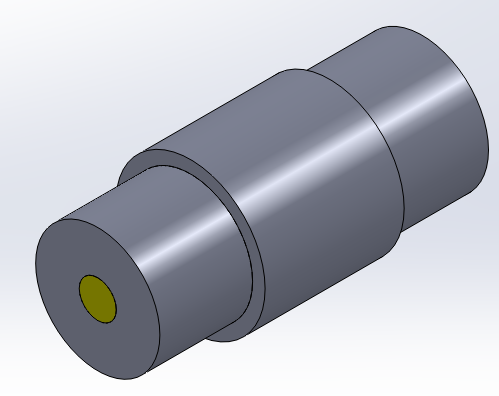
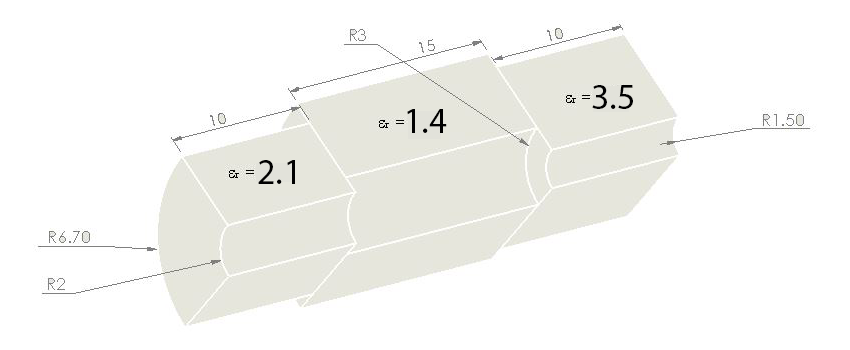
Figure 1 - Coaxial cable with discontinuities (Top) with dimensions (Bottom)
Simulation
Performing an S-parameters study in HFWorks on the discontinuous coaxial cable section allows us to examine its behavior in both the frequency domain (via Scattering Parameters) and the time domain (through TDR simulation). Transitioning to the time domain from frequency domain expressions requires an IFFT on multiple frequency samples. Thus, a TDR simulation necessitates more than one frequency. We initiate with an S-parameter analysis, yielding Figure 3 results, where S11 shows attenuation exceeding -25 dB at 5 GHz. These frequency domain findings will be used for subsequent TDR analysis through IFFT.
Solids and Materials
Figure 1 presents an assembly or structure comprised of three parts, sharing similar shapes but having slight variations in dimensions and relative permittivities. It is these differences that give rise to the discontinuities we are interested in. The predefined material properties for these blocks or bodies involve a relative permittivity of 2.1 for the central part and 3.5 for the lateral ones. When incorporated into the algorithmic calculations, these parameters introduce heterogeneity into the model, leading to discontinuities in the expressions of electrical parameters such as Voltage, Current, Impedance, and Excitation. Analyzing the plots of these expressions is crucial for investigating the internal structure of any transmission model.
All the materials in this model exhibit isotropic permittivity, which means that the permittivity parameter is a scalar value. In contrast, for orthotropic materials, the permittivity would be represented by a 3 by 3 matrix to account for its directional properties.
Load/ Restraint
In this scenario, we assume Pure TEM propagation, activated via the "Pure TEM" checkbox in the first port. To ensure meaningful solutions in a single-conductor hollow waveguide, a signal boundary condition is required, as per Maxwell's equations. Applying boundary conditions, alongside symmetry (PECS or PMCS), streamlines calculations and yields more realistic results by automatically considering contributions from symmetric portions of the model. The choice between magnetic or electric boundaries depends on the electric field's direction in relation to specific faces or planes.
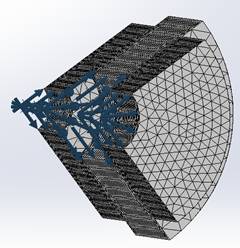
Meshing
HFWorks' mesher calculates the average mesh element size according to user-defined mesh controls. Subsequently, it conducts volume meshing. The mesh elements become smaller as they approach the surfaces specified in the mesh control settings, such as the inner wire of the coaxial cable. Additionally, users have the option to specify the mesh growth rate, which is typically set to a default value of 1.4.
Results
As stated at the outset of this note, HFWorks employs the Finite Element Method (FEM) solver to perform calculations for solving Maxwell's equations in the frequency domain. To derive expressions for the reflected waves, an Inverse Fast Fourier Transform (IFFT) is applied to the frequency-domain field expressions. These resulting expressions serve as the basis for calculating impedance, voltage, and current measurements at the specified port.
The accompanying figure displays the S11 plot across the frequency range of 0.625 GHz to 5 GHz. This frequency window needs to be sufficiently wide to facilitate the computation of IFFT for various signals.
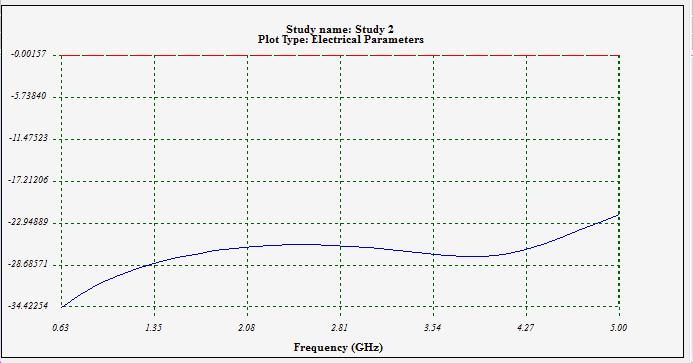
Figure 3 - Reflection coefficient and insertion loss
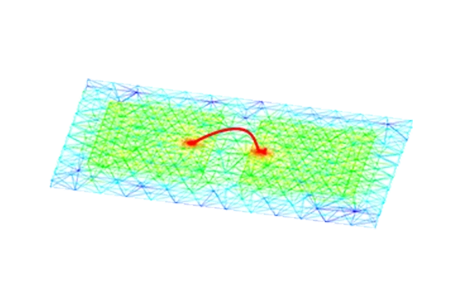
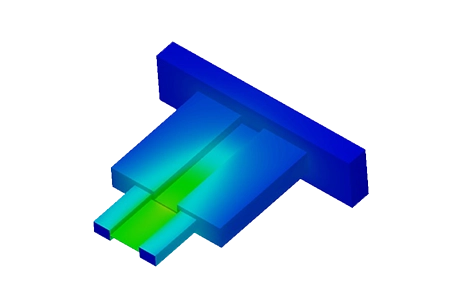
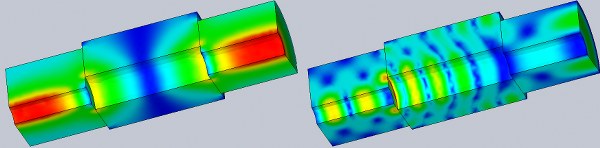
We can visualize the electric field distribution at different frequencies and create animations by varying the omega-T phase. In the figure presented, we illustrate two instances of this distribution at different omega-T phases.
![Distance To Fault with impedance information [1]](/media/images/product/large/33e75ff09dd601bbe69f351039152189_5.png)
Figure 4 - Distance To Fault with impedance information [1]
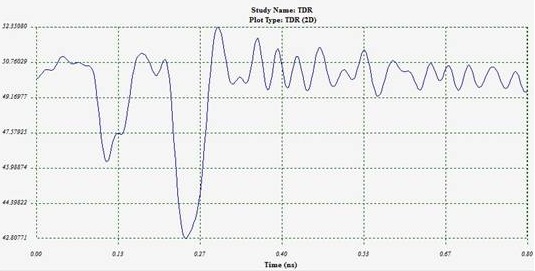
Figure 5 - Impedance seen from Port 1
[2] below imposes a constraint on the system's resolution.
![]()
Locating Mismatches
![]() For transmission lines with air dielectric. For the general case, where
For transmission lines with air dielectric. For the general case, where ![]() is the dielectric constant:
is the dielectric constant:
![]()
![]()
![]() = velocity of propagation; T = transit time from the monitoring point to the mismatch and back again.
= velocity of propagation; T = transit time from the monitoring point to the mismatch and back again.
Conclusion
The application note delves into the analysis of a coaxial cable with discontinuities using Time-Domain Reflectometry (TDR) solutions in HFWorks. By transmitting a pulse signal and examining reflections, designers gain insights into signal behavior. HFWorks allows a seamless transition from S-parameter to TDR analysis, facilitating a comprehensive understanding of the cable's performance. Through simulations, the effects of material properties, boundary conditions, and meshing on signal integrity are explored. The note emphasizes the importance of accurately locating mismatches and analyzing impedance variations for optimizing transmission systems. References to industry literature supplement theoretical discussions. In conclusion, HFWorks offers robust tools for analyzing transmission lines, aiding in the design of efficient and reliable communication systems.
References
[1 ] Time Domain Reflectometry (TDR) and S-parameters: Advanced Measurements …not only Signal Integrity - July2009
[2 ] Tektronix, enabling innovation : TDR Impedance Measurements: Foundation for Signal Integrity
[3 ] Time Domain Reflectometry Theory Application Note 1304-2- Agilent Technologies