A Horn Antenna
Horn antennas find extensive use in UHF (300 MHz-3 GHz) and higher frequency ranges, renowned for their directional patterns and high gain characteristics. Specifically, an E-plane horn, characterized by its flared design in the E-plane, exhibits these properties. This example presents a fundamental model of an ideal horn, with dimensions of approximately 3000 mm. To optimize efficiency, the solver leverages the model's symmetry, analyzing only one-quarter of the structure.
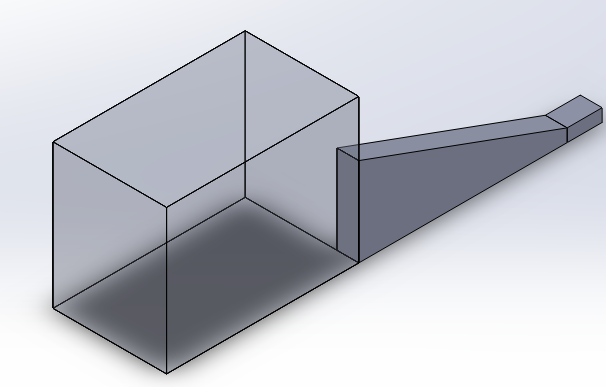
Figure 1 - Quarter Ehorn antenna model
Simulation
To simulate the behavior of this quarter E-horn antenna, we initiate an Antenna study, pinpointing the pertinent frequency range of operation (approximately 0.4 GHz). In the context of antenna simulation, we introduce radiation boundaries, a distinctive characteristic of such simulations, to surfaces that truncate the surrounding air. This emulates the conditions of an anechoic chamber, ensuring realistic simulation results.
Solids and Materials
The antenna's internal space is filled with air. To achieve this, we designate air as the filling material for all the solids within the antenna. Subsequently, the faces of these solids are treated as Perfect Electric Conductors, their properties adjusted based on the relative direction of the electric field, ensuring an accurate representation of electromagnetic interactions.
Load/ Restraint
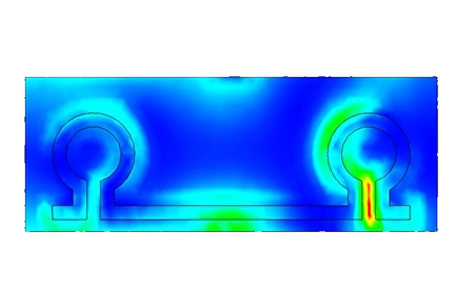
The port is strategically placed on the small lateral face of the antenna for precise analysis. Lateral boundaries are assigned Perfect Electric Conductor (PEC) boundaries, while symmetry planes of the model are assigned a combination of PECs and Perfect Magnetic Conductors (PEMs) boundaries, ensuring accurate simulation and reflective properties.
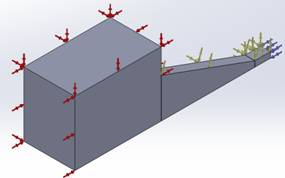
Figure 2 - Boundaries: Red= Radiation, yellow= PEC, blue= Port
Given the model's relatively simple shapes, a uniform mesh across the assembly should suffice, eliminating the need for specific mesh controls. Instead, we specify the number of mesh elements to be generated along the diagonal of each solid body to ensure an adequate mesh for simulation.
Results
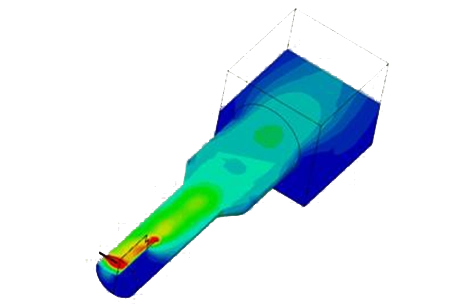
Figure 3 - Wave propagation in the antenna at 0.4 GHz
The figure illustrates the variation of the reflection coefficient at the port. As emphasized at the outset of this report, HFWorks calculates Scattering Parameters within antenna studies. In this specific case, the antenna demonstrates optimal matching performance at 0.9 GHz.
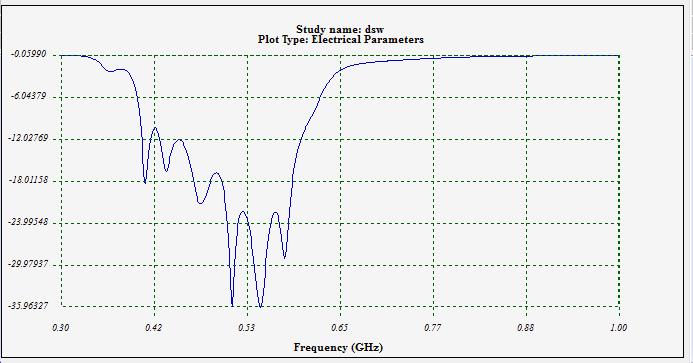
Figure 4 - Variations of reflection coefficient at the antenna's port
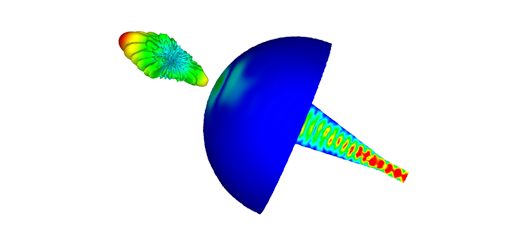
The polar plots encompass a broad spectrum of parameters, including radiated electric field, radiation intensity, directivity, gain pattern, axial ratio, and more. The presented plot depicts the radiated electric field (Radiation Intensity) at 0.4 GHz, providing a comprehensive view of the antenna's performance characteristics.
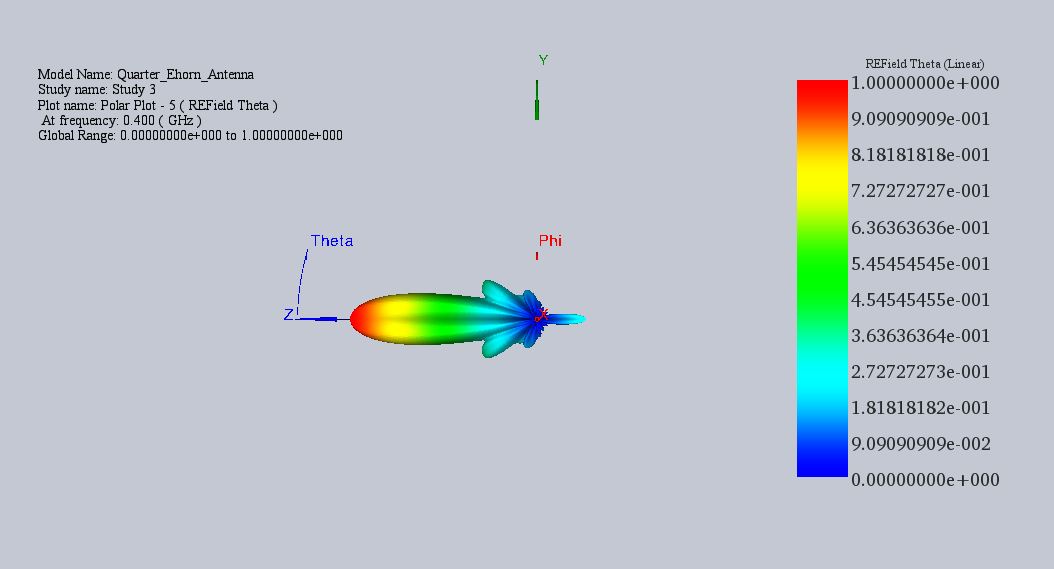
Figure 5 - Radiated Electric field vector distribution at 0.4 GHz
Conclusion
References
[1] M.S. Narasimhan and V. Venkateswara Rao, "A correction to the available radiation formula for E-Plane sectorial horns", IEEE Trans. Antennas Propagat., vol. AP-21, pp. 878-879, Nov 1973.