More Electric Aircraft
MEA represents a sustainable aviation shift, focusing on eco-friendly electric motors like radial flux PMSMs, known for high efficiency and power density, crucial during take-off and landing. These motors enhance energy conversion, with material and design optimizations like stator and rotor thickness adjustments critical for improving power density and ensuring aerospace safety.
Aerospace Motor Design Challenges
Optimizing PMSMs for electric aircraft involves enhancing power density through lightweight structures, achieving the required torque with minimal ripple. The challenge lies in designing a motor that balances reduced weight, rigidity, and strength, making compact design a critical goal for aerospace applications. This balance between power density and size/weight is a key obstacle in aerospace motor development.
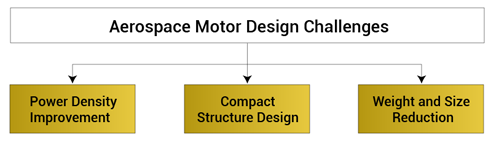
Fig. 1. Motors Design Constraints for Electric Aircraft Application
EMWorks Solutions
This study uses EMWorks2D to explore improving aerospace motor power density by adjusting geometric parameters like the pole arc coefficient and core back yoke thickness. These modifications aim to create an optimized, lightweight motor design without compromising performance, highlighting the importance of balancing motor efficiency, torque, and weight through advanced simulation and design tools.
Design Specifications
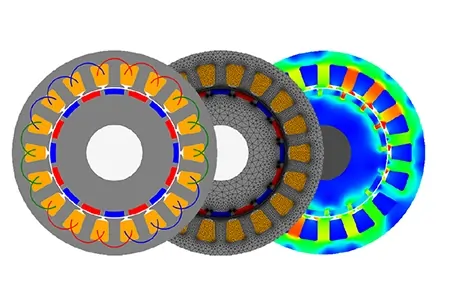
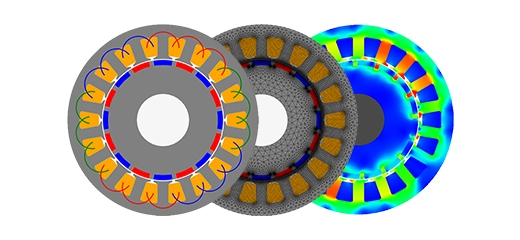
Two models of PMSM are considered to have a different combination of slots/poles are shown in the following figure [4]. Model I represents a combination of 6 slots-8poles while Model II contains 12 slots and 10 poles. The geometry and electromagnetic simulation for both models are accomplished based on specifications in the table below [4].
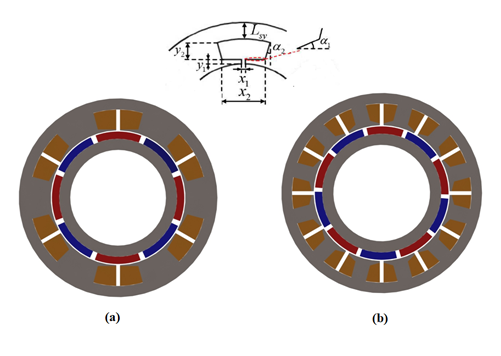
Fig. 2. Topologies of the Proposed PMSMs: (a) Model I: 6 Slots-8 Poles, (b): Model II: 12 Slots-10 Poles
| Symbol | Parameters | Model I | Model II |
| P | Rated Output Power (KW) | 10 | 10 |
| T | Rated Torque (N.m) | 10.6 | 10.6 |
| W | Rated Speed (rpm) | 9000 | 9000 |
| Dso | Stator Outer Diameter (mm) | 108 | 108 |
| Dsi | Stator Inner Diameter (mm) | 73.2 | 73.2 |
| Dro | Rotor Outer Diameter (mm) | 64 | 64 |
| Dri | Rotor Inner Diameter (mm) | 52 | 52 |
| Lsy | Stator Back Yoke Thickness (mm) | 6 | 5.6 |
| Lry | Rotor Back Yoke Thickness (mm) | 6 | 6 |
| Lair | Air-Gap Length (mm) | 0.6 | 0.6 |
| Cp | Pole Arc Coefficient | 0.9 | 0.9 |
| Tm | Magnet Thickness (mm) | 4 | 4 |
| Laxial | Active Axial Length (mm) | 36 | 36 |
| Im | Amplitude of Current (A) | 38 | 38 |
| J | Current Density (A/mm2) | 10.6 | 10.6 |
| x1 | Slot Parameter (mm) | 2 | 2 |
| x2 | Slot Parameter (mm) | 22 | 12.5 |
| y1 | Slot Parameter (mm) | 0.5 | 1 |
| y2 | Slot Parameter (mm) | 9 | 10 |
| a1 | Slot Parameter (°) | 0 | 15 |
| a2 | Slot Parameter (°) | 15 | 15 |
| Component | Material | ||
| Magnet | SmCo30 | ||
| Core Back Yoke | HiperCo50 | ||
Table 1. Specifications of PMSMs Studied Models
Simulation Results
1. Magnetic Flux Density and Average Torque for Initial Models
The electromagnetic simulations of the designed models permit to visualization of the magnetic flux density and calculation of the average torque. These simulations allow for a detailed analysis of the behavior of the electromagnetic fields and currents in the system, which can help to optimize the design and ensure that it meets the desired performance criteria.
As illustrated in the following figure, the average torque is equal to 10.8 N.m and 11.78 N.m respectively for Model I and II. The average torque satisfies practically the desired rated torque for both models. The torque ripple is equal to 4.26% for Model I and 3.9% for Model II. The torque ripple for Model II is lower, its estimated power density is better than that of Model I.
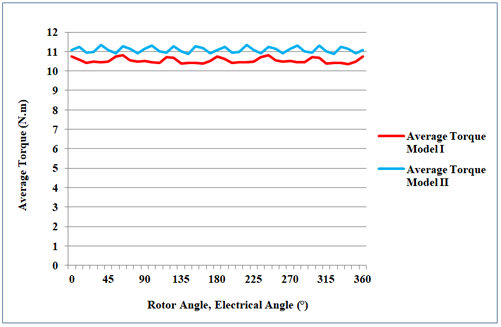
Fig. 3. Average Torque Versus Electrical Angle for PMSM Models
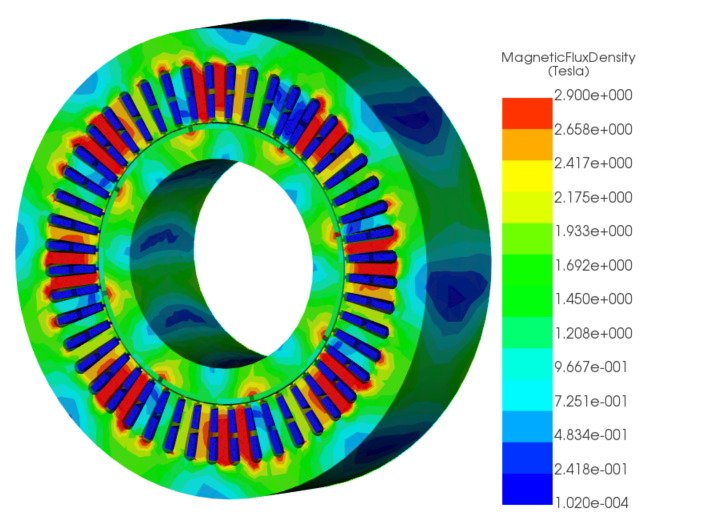
Figure 4 demonstrates that the magnetic flux density in most areas of the core back yoke is between 1.58 T and 2.1 T. For HipeCo50 material, the saturation flux density is 2.35. It is a high-performance magnetic material that offers several advantages over other types of magnetic materials, including high magnetic permeability, low core loss, and excellent thermal stability. These properties make it a popular choice for use in a wide range of electromagnetic applications. Thus, the iron core material is not fully used and the two models need to be optimized to give an improved power density motor. The optimization process consists of minimizing the machine mass by varying the pole arc coefficient and core back yoke thickness. The main optimization objective is the achievement of an improved aerospace motor that satisfies the desired rated torque with a lower torque ripple.
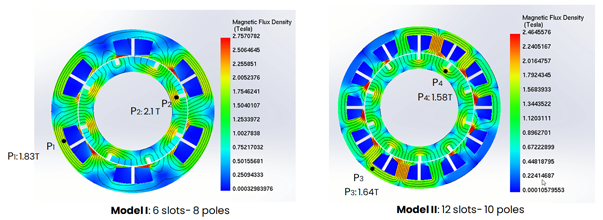
Fig. 4. Magnetic Flux Density in Studied Models of PMSMs
2. Average Torque and Torque Ripple for Optimized Models
Optimization by Varying Pole Arc Coefficient
According to the following figure, the optimal value of the pole arc coefficient is 0.945 and 0.917 respectively for Models I and II. These values ensure the desired rated output torque with the lowest torque ripple.
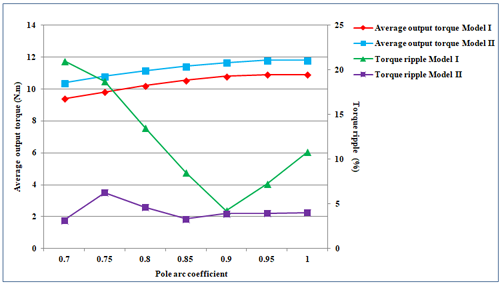
Fig. 5. Output Torque and Torque Ripple Under Different Pole Arc Coefficient
Optimization by Varying Stator Back Yoke Thickness
Output torque and torque ripple under different values of rotor back yoke thickness demonstrate that the optimal value of rotor yoke thickness respecting optimization objective is 5.5 mm and 4 mm for both Model I and II. If the stator back yoke thickness exceeds the optimal value, the average output torque and the torque ripple are practically unchangeable compared to the optimal point. Whereas, the average torque is less than the optimal value if the thickness is below the optimal thickness while the torque ripple is larger than the optimal point.
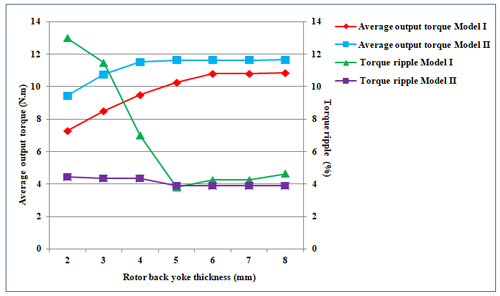
Fig. 6. Output Torque and Torque Ripple Under Different Rotor Back Yoke Thickness
Optimization by Varying Rotor Back Yoke Thickness
Optimal values of stator back yoke thickness verifying the optimization target are 5 mm for Model I and 4 mm for Model II. If the rotor back yoke thickness is greater than the optimal value, the average output torque and the torque ripple have almost the same value compared to the optimal point. On the other hand, the average torque is less than the optimal value if the thickness is below the optimal thickness while the torque ripple is larger than the optimal point.
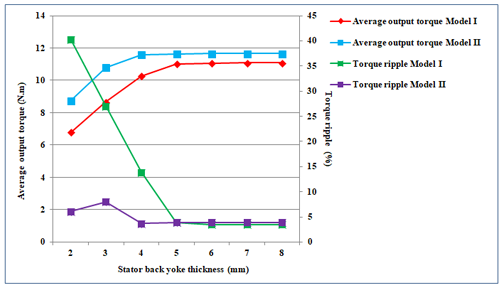
Fig. 7. Output Torque and Torque Ripple Under Different Stator Back Yoke Thickness
Analysis According to the Estimated Mass
According to previous results, two optimal machines are presented with the adoption of combined three optimal parameters as mentioned in Table 2, labeled as Optimized Model I and Optimized Model II.
| Item | Pole Arc Coefficient | Rotor Back Yoke Thickness (mm) | Stator Back Yoke Thickness (mm) |
| Optimized Model I | 0.945 | 5.5 | 5 |
| Optimized Model II | 0.917 | 4 | 4.1 |
Table 2. Parameters of the Optimized Models
The output torque of the studied models above is presented in the following figure. The output torque for each model and its optimized structure is practically the same. The only difference between Model I and Optimized Model I is the adoption of a lightweight structure as are Model II and Optimized Model II. We can conclude that the lightweight structure design doesn’t influence the output torque.
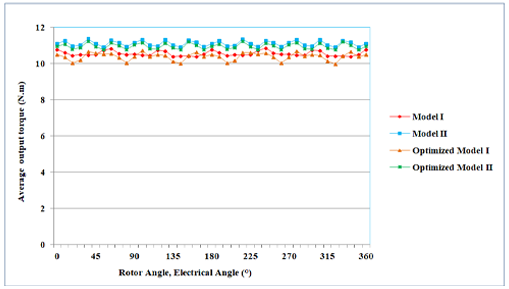
Fig. 8. Average Output Torque for Studied Models
The calculation of the machine's mass, as shown in Table 3, proves that PMSM Model I can reduce more mass compared to Model II. For the optimized models, the Optimized PMSM Model II provides less mass than the machine corresponding to Optimized Model I.
| Mass (g) | Initial Model I | Initial Model II | Optimized Model I | Optimized Model II |
| Stator | 1000.4 | 928.2 | 731.5 | 759.6 |
| Rotor | 319.6 | 319.6 | 272.3 | 201.8 |
| Magnet | 232.6 | 232.6 | 244.1 | 236.9 |
| Total mass | 2223.7 | 1980.7 | 1919 | 1698.6 |
Table 3. Estimated Mass for PMSMs Models Before and After Optimization
Results Comparison: EMWorks2D-Reference Article [4]:
Simulation results using EMWorks2D are presented in tables below comparing to results based on the reference article. The first table represents the average output torque as a function of the pole arc coefficient and iron core back yoke thickness. The second table regroups the output average torque of the studied models before and after optimization. The results are close and the error percentage is low.
| Varied Parameter | Average Torque Model I (N.m) | Average Torque Model II (N.m) | ||
| Pole Arc Coefficient | EMWorks2D | Reference Article | EMWorks2D | Reference Article |
| 0.7 | 9.39 | 9.2 | 10.38 | 10 |
| 0.75 | 9.82 | 9.8 | 10.8 | 10.4 |
| 0.8 | 10.21 | 10 | 11.15 | 10.8 |
| 0.85 | 10.55 | 10.3 | 11.43 | 11.1 |
| 0.9 | 10.8 | 10.8 | 11.65 | 11.3 |
| 0.95 | 10.92 | 11 | 11.8 | 11.4 |
| 1 | 10.92 | 11.1 | 11.81 | 11.6 |
| Rotor Back Yoke Thickness (mm) | EMWorks2D | Reference Article | EMWorks2D | Reference Article |
| 2 | 7.28 | 8 | 9.46 | 9.8 |
| 3 | 8.52 | 9.1 | 10.76 | 10.8 |
| 4 | 9.5 | 10 | 11.54 | 11.2 |
| 5 | 10.27 | 10.8 | 11.64 | 11.3 |
| 6 | 10.8 | 11.1 | 11.64 | 11.3 |
| 7 | 10.8 | 11.1 | 11.64 | 11.3 |
| 8 | 10.87 | 11.1 | 11.65 | 11.3 |
| Rotor Back Yoke Thickness (mm) | EMWorks2D | Reference Article | EMWorks2D | Reference Article |
| 2 | 6.79 | 6.2 | 8.75 | 8 |
| 3 | 8.66 | 8.5 | 10.8 | 10.2 |
| 4 | 10.26 | 10.2 | 11.59 | 11.2 |
| 5 | 11.02 | 11 | 11.64 | 11.3 |
| 6 | 11.07 | 11 | 11.65 | 11.3 |
| 7 | 11.08 | 11 | 11.65 | 11.3 |
| 8 | 11.08 | 11 | 11.65 | 11.3 |
| Results Origin | Average Output Torque-Model I (N.m) | Average Output Torque-Model II (N.m) | Average Output Torque-Optimized Model I (N.m) | Average Output Torque-Optimized Model II (N.m) |
| EMWorks2D | 10.8 | 11.37 | 10.64 | 11.21 |
| Reference Article | 10.89 | 11.28 | 10.91 | 11.27 |
Conclusion
In this study, the design and electromagnetic simulations of 2 models of PMSM dedicated to electric aircraft are investigated using the EMWorks2D product. Accurate results show that PMSM model II can provide higher output torque with lower torque ripple compared to Model I. The only advantage of machine Model I is the lower operating frequency so less iron core loss. On the other hand, the core yoke of both machines is not saturated and needs to be optimized to give an improved high-power density motor. Optimizing pole arc coefficient and core back yoke thickness permits a combined optimal solution (Optimized PMSM Model II) that guarantees the obtaining of the desired rated output torque and reduces the total mass compared to Optimized PMSM Model I. Therefore, the lightweight structure design doesn’t influence the output torque.
References
[1]: R. T. Naayagi, "A review of more electric aircraft technology," 2013 International Conference on Energy Efficient Technologies for Sustainability, Nagercoil, India, 2013, pp. 750-753, doi: 10.1109/ICEETS.2013.6533478.
[2]: B. Sarlioglu and C. T. Morris, "More Electric Aircraft: Review, Challenges, and Opportunities for Commercial Transport Aircraft," in IEEE Transactions on Transportation Electrification, vol. 1, no. 1, pp. 54-64, June 2015, doi: 10.1109/TTE.2015.2426499.
[3]: P. Wheeler and S. Bozhko, "The More Electric Aircraft: Technology and challenges," in IEEE Electrification Magazine, vol. 2, no. 4, pp. 6-12, Dec. 2014, doi: 10.1109/MELE.2014.2360720.
[4]: Fang, S., Wang, Y., & Liu, H. (2020). Design study of an aerospace motor for more electric aircraft. IET Electric Power Applications, 14(14), 2881-2890.