Linear Switched Reluctance Motor
Linear actuators, essential for converting energy into linear motion, include electric variants, notably linear switched reluctance motors (SRMs). These SRMs offer precise position control and benefit from semiconductor technology advancements. Analytical tools aid in optimizing SRMs for enhanced performance. SRMs feature simple, robust designs with stator windings overlapping stator poles and rotor poles made of salient steel. Precise commutation timing, typically facilitated by encoders or Hall effect sensors, ensures optimal operation.
![Typical linear switched reluctance motor structure [2]](/ckfinder/userfiles/images/Typical-linear-switched-reluctance-motor-structure.jpg)
Figure 1 - Typical linear switched reluctance motor structure [2]
This article employs both 2D and 3D electromagnetic simulations to analyze linear switched reluctance motor examples. It computes magnetic fields, inductance, and force results, which are then compared to references for validation.
Longitudinal Linear Switched Reluctance Motor
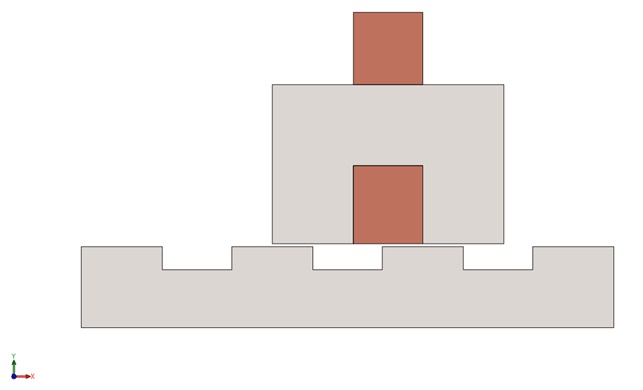
Figure 2 presents a 2D geometry depicting a longitudinal linear switched reluctance motor [3]. Constructed with steel 1008 for both translator and stator components, known for its high magnetic field saturation value, the motor features a stranded coil comprising 234 turns of copper. The simulation evaluates the axial force along the x-axis across different translator positions and current magnitudes, alongside calculating inductance results. Leveraging the axial invariant geometry, EMWorks2D conducts a parametric sweep analysis ensuring accuracy in simulation outcomes.
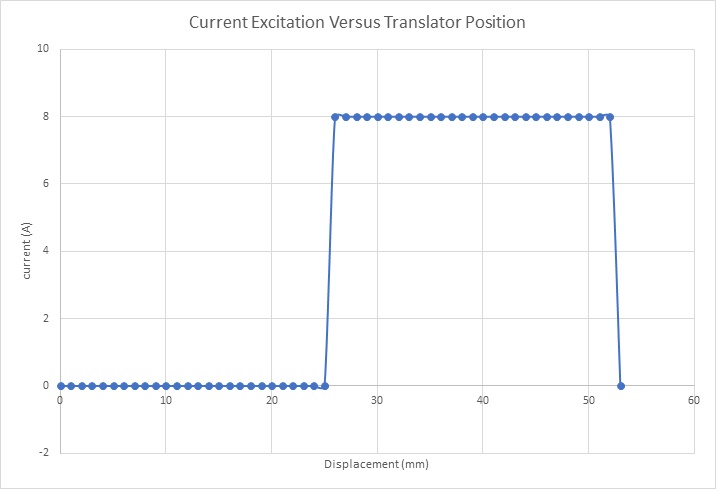
Below is the excitation current waveform depicted. The simulation utilizes this waveform across various magnitudes and translator positions. Notably, the displacement constant for the studied motor stands at 52mm.
Results
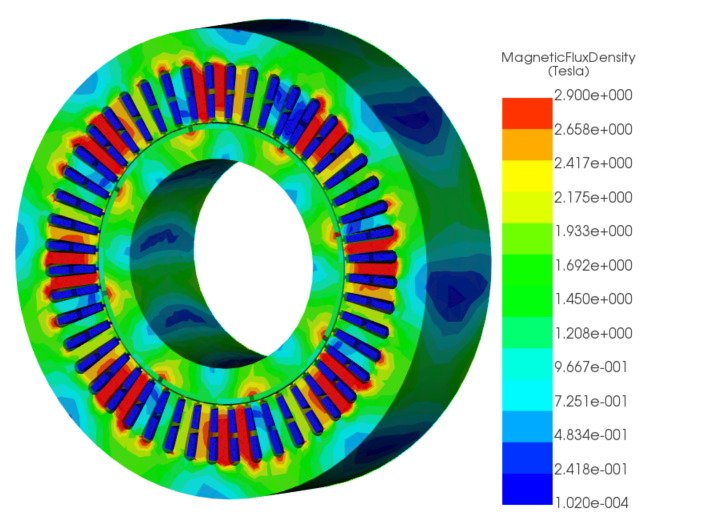
2D Magnetic static results are obtained for all translator positions using a parametrization study in EMWorks2D. In Figure 4a), magnetic flux density at an unaligned position (26mm) with an excitation of 8A is depicted. High spots of magnetic flux density, reaching around 2T, are observed at the translator and stator poles. The predominant blue color indicates areas with field values below 0.55T, corresponding to a maximum magnetic reluctance at this position. Figure 4b) showcases magnetic flux density at the aligned position (52mm) with the same excitation current. Here, the magnetic field extends over a larger area of the motor model, ranging mainly between 0.6T and 1.66 T. This position is characterized by its minimum magnetic reluctance. An animation illustrating translator displacement from an unaligned to an aligned position is presented in Figure 5.
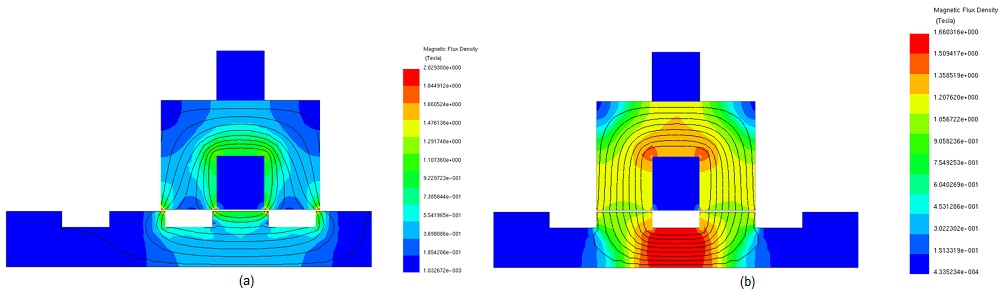
Figure 5 displays an animation illustrating the translator displacement from an unaligned to an aligned position.
Figure 5 - Animation of the magnetic flux (5A)
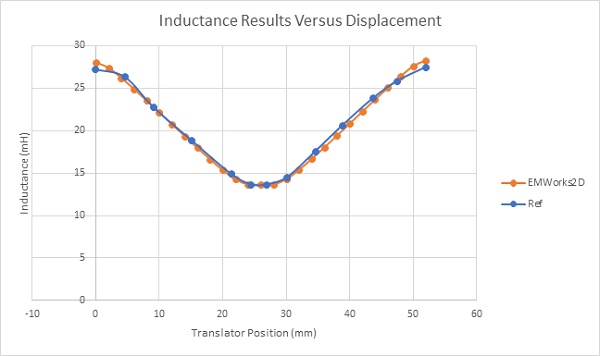
Figure 6 illustrates 2D inductance results plotted against translator displacement, spanning two aligned positions (0 and 52 mm). The inductance peaks at both aligned positions, reaching a maximum of 28mH, owing to the low magnetic reluctance noted earlier. Conversely, at the unaligned position, inductance hits its nadir (13.66 mH) due to maximum magnetic reluctance.
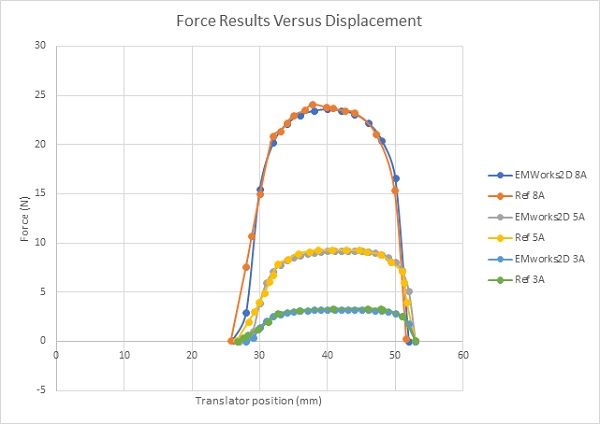
Figure 7 showcases x-component force results versus translator movement across various DC currents. These results behave uniformly across different excitations. Initially zero, force ascends from the unaligned position upon excitation, culminating in a peak value of 24N at 40mm (8A). Subsequently, force declines towards nullity at the aligned position (52mm). Notably, high force values of the linear SRM are attained in partially overlapping positions situated between unaligned and aligned positions. Both figures exhibit excellent agreement between EMWorks2D and References [3],[4].
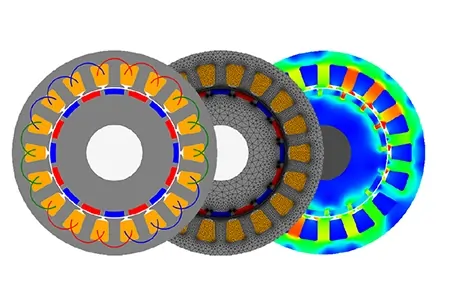
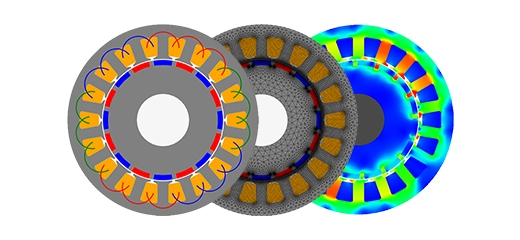
In this section, we investigate a transverse linear switched reluctance motor using EMS, a 3D electromagnetic simulation software. Figure 8 showcases the CAD model of the simulated motor. We maintain consistent material and coil settings with the previous study for this example.
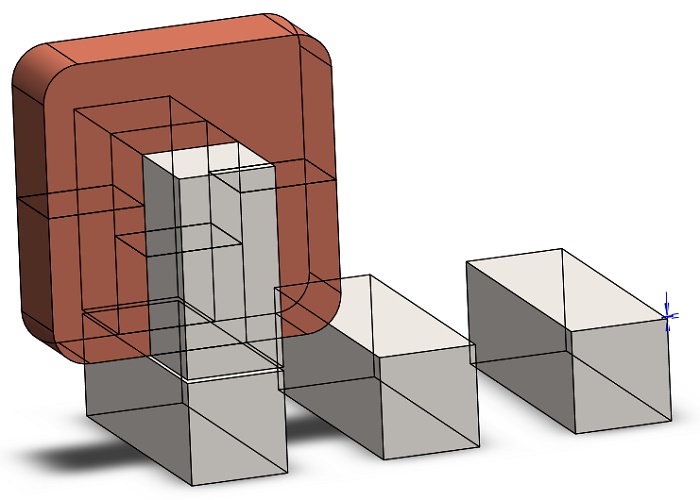
Figure 9a displays the magnetic flux density of the motor at an unaligned position, while Figure 9b shows it at an aligned position. Similar interpretations as mentioned earlier can be extracted from these figures, as both longitudinal and transverse linear switched reluctance motors operate on the same principle.
Furthermore, Figure 10 presents an animation illustrating the magnetic flux versus position.
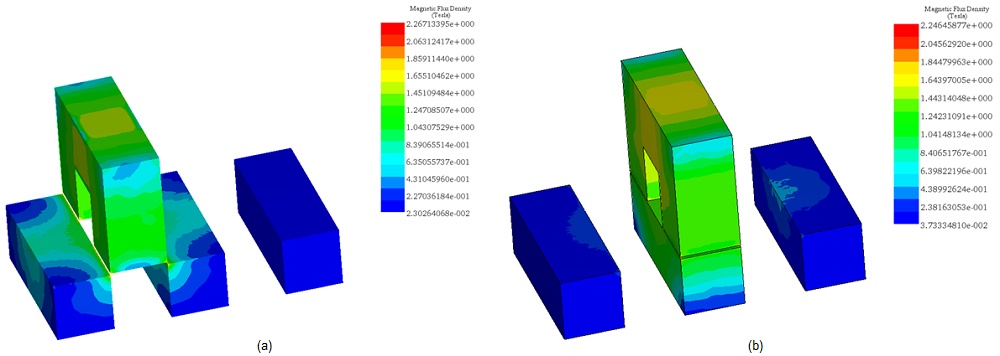
Figure 10 - Animation of the magnetic field vector plot
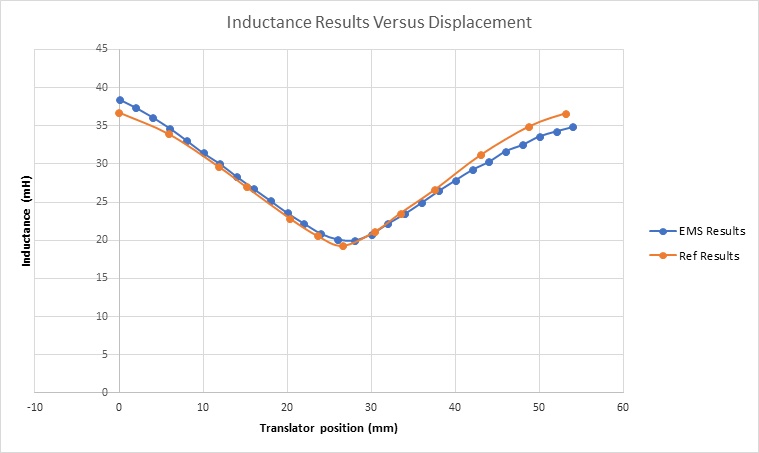
Figure 11 illustrates the inductance results of the transverse LSRM plotted against translator displacement. Notably, the inductance curve exhibits two peak values at aligned positions, corresponding to the machine's minimum magnetic reluctance. Conversely, inductance reaches its minimum when magnetic reluctance is at its maximum, observed at the unaligned position.
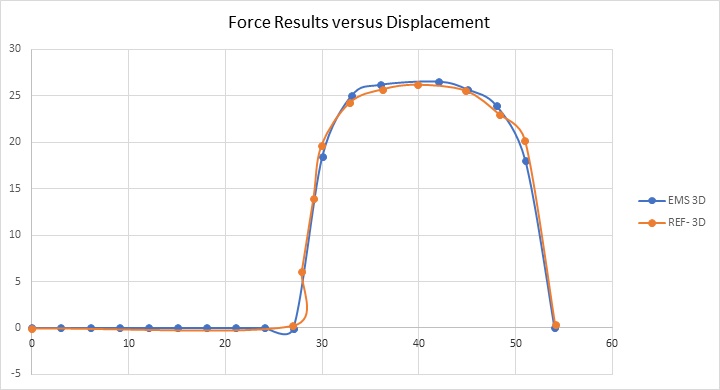
Additionally, Figure 12 depicts the x-component of the reluctance force at 8A. It initiates an upward trend at 27 mm, reaching peak values ranging from 20 N to 26 N within the displacement interval of 30-50 mm, before returning to null at 54 mm.
Comparatively, the transverse linear switched reluctance motor generates a maximum force of 26.3N, surpassing that of the longitudinal counterpart. Therefore, the transverse machine is preferred for its superior force density.
The average force of both longitudinal and transverse switched reluctance motors is computed using the formula provided in [2] and [3].
$$ F_{\text{average}} = \frac{1}{2} \cdot I^2 \cdot \frac{L_a - L_{\text{una}}}{W_x} $$
The average force of the transverse switched reluctance motor, approximately 10.28N, surpasses that of the longitudinal switched reluctance motor, which is around 8.35N. Consequently, the transverse machine exhibits higher force density compared to the longitudinal machine. However, it's worth noting that the longitudinal structure represents a more economical option, as it requires less steel for the stator [4].
Conclusion
This application note explores the performance and design optimization of Linear Switched Reluctance Motors (LSRMs) through 2D and 3D electromagnetic simulations. LSRMs, known for converting energy into linear motion, are examined for their magnetic fields, inductance, and force outputs. The study contrasts longitudinal and transverse LSRM configurations, using steel 1008 for its high magnetic saturation properties to enhance performance. Simulations demonstrate the variation in magnetic flux density with translator position and current, highlighting the role of magnetic reluctance in determining inductance and force output. High flux density areas indicate positions of maximum and minimum magnetic reluctance, directly affecting the motor's performance. The analysis shows that inductance peaks at aligned positions, where magnetic reluctance is lowest, while force results are significant in partially overlapping positions, indicative of the motors' precise positioning capabilities. The transverse LSRM model is noted for its superior force density, offering advantages in applications requiring high force output, although the longitudinal model may be more economically advantageous due to reduced material requirements.
References
[1] J Corda and E Skopljak. Linear switched reluctance actuator. In Electrical Machines and Drives, 1993. Sixth International Conference on, pages 535–539. IET, 1993.
[2] R. Krishnan. RELUCTANCE MOTOR DRIVES. IEEE The Bradley Department of Electrical and Computer Engineering Fellow, Center for Organizational and Technological Advancement (COTA) Virginia Tech, Blacksburg, Virginia
[3] S.Darabi, M.Ardebili. Analysis of Linear Switched Reluctance Motor with Longitudinal Flux Linkage Using 2D-FEM Compared to 3D-FEM. Department of Elec. Eng. K.N.Toosi University of Technology K.N.Toosi University of Technology, KNTU Tehran, Iran. 2011 2nd Power Electronics, Drive Systems and Technologies Conference
[4] Saeed Darabi, Yousef Alinejad Beromi, and Hamid Reza Izadfar. Comparison of Two Common Configurations of LSRM: Transverse Flux and Longitudinal Flux. Dept. of Elec. & Comp. Eng. Semnan University Semnan, Iran. 2012 International Conference and Exposition on Electrical and Power Engineering (EPE 2012), 25-27 October, Iasi, Romania