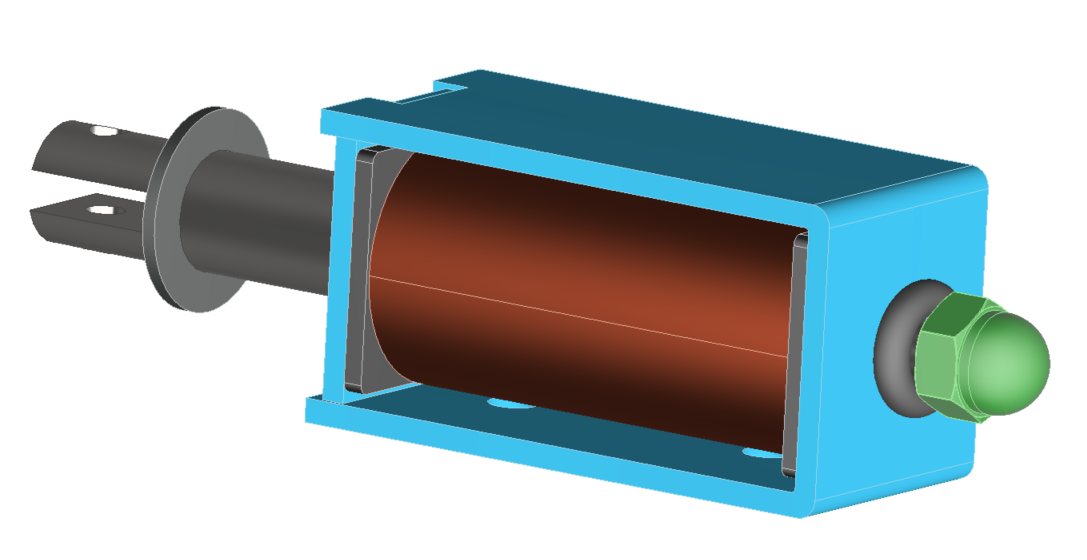
A Voice Coil Actuator
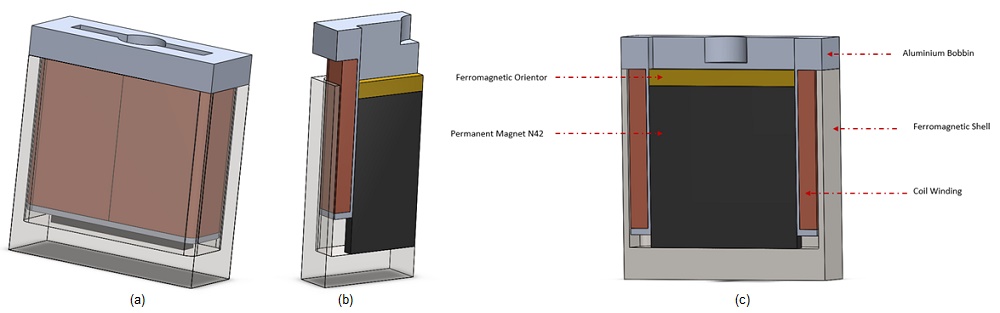
This article examines a voice coil actuator [1] with optimized parameters from [1]. Static analysis calculates Lorentz force versus current and actuator positions, compared to data in [3]. Electrodynamic simulation computes mechanical outputs. EMWorks conducts the simulations, with Figures 1a), 1b), and 1c) illustrating the device. The actuator features a stranded copper coil with 760 turns, moving within an airgap zone between a ferromagnetic shell and a stationary, axially magnetized neodymium permanent magnet (N42). Soft iron components enhance permeability, with a flux oriented guiding the field and a bobbin supporting the coil.
Simulation and Results
Static Simulation -Geometrical Parametric Sweep
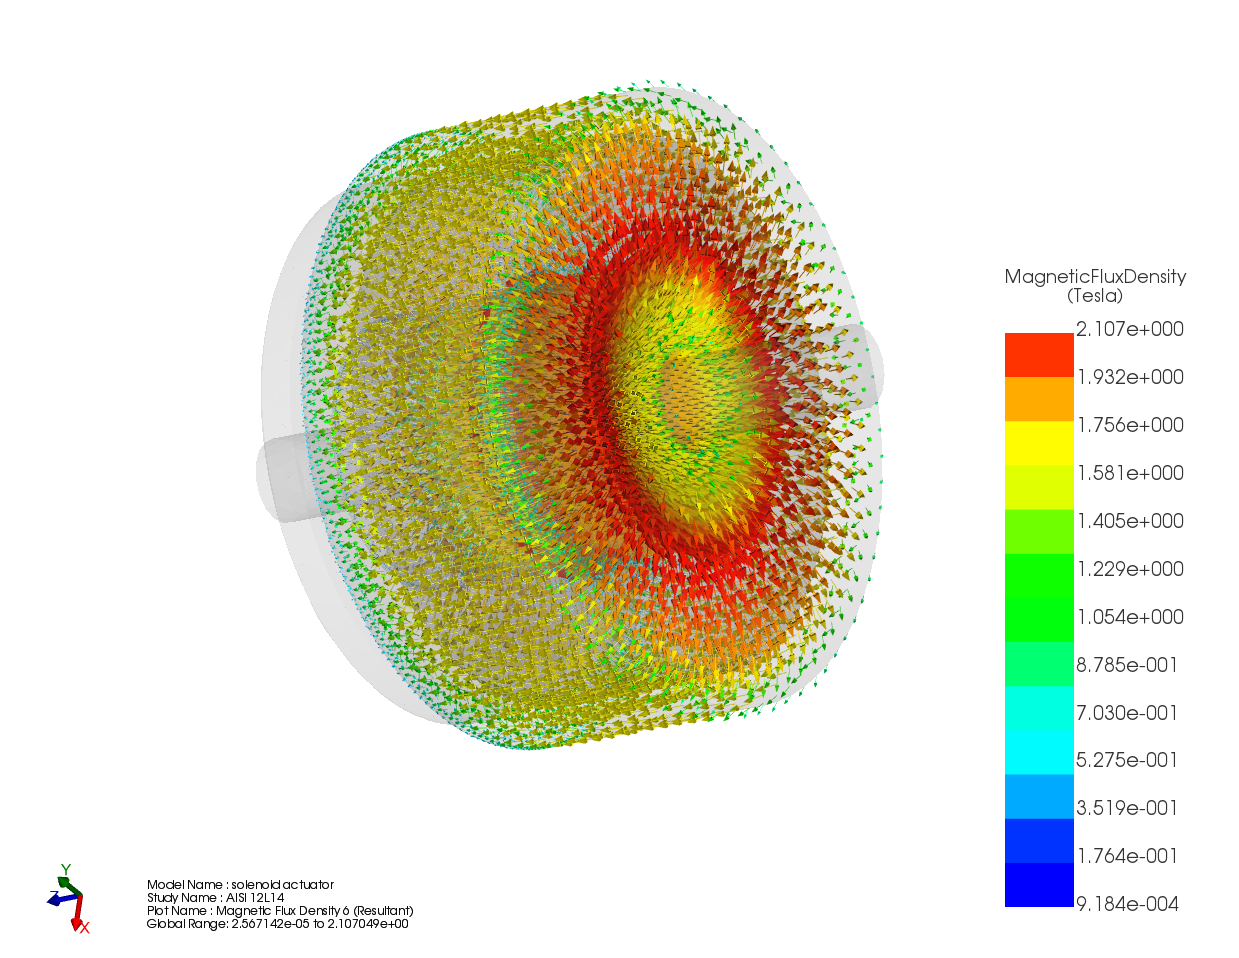
Initial simulations involve varying DC current rates while adjusting the positions of the coil and bobbin. A parametric sweep study analyzes magnetic flux, Lorentz force, and coil parameters. Figures 2a) and 2b) depict full and cross-sectional views of the magnetic flux density at +10A with the assembly positioned at 10mm. The average magnetic flux measures approximately [1.3T, 1.74T]. Magnetic field vector plots are illustrated in Figures 3a) and 3b), with a coil current density of 1e8A/m^2.
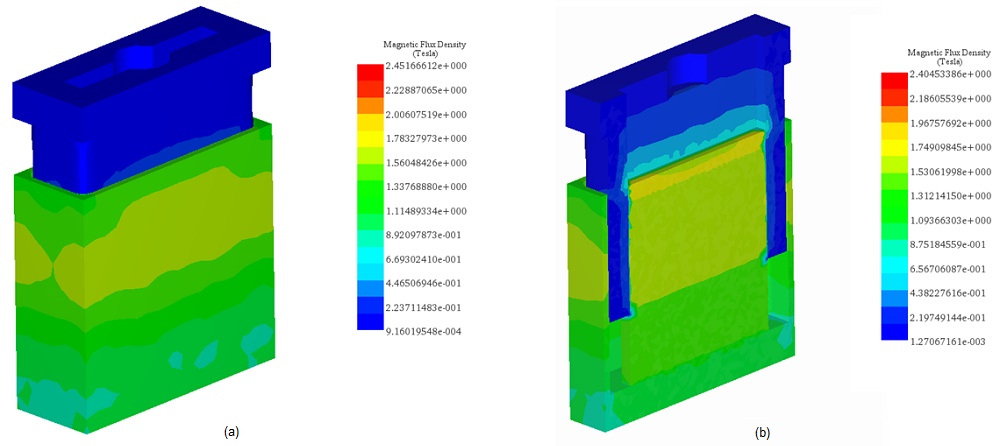
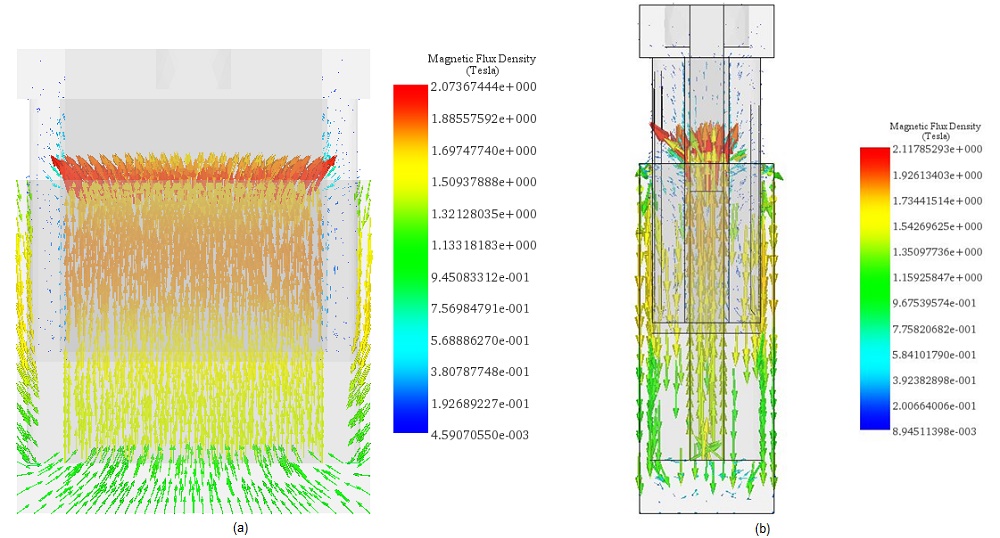
Figure 4 presents experimental [3] and simulation results of the Lorentz force at varying DC currents and stroke values. The maximum force (approximately 33N) occurs at -10A and a 10mm position. For stroke values between 4mm and 16mm, the measured force remains relatively constant across different current rates, suggesting consistent force rates with larger strokes for increased acceleration. Figure 5 displays a plot of force peak values for different currents, demonstrating a linear relationship between force and current. This highlights the straightforward and adaptable control of actuator force density.
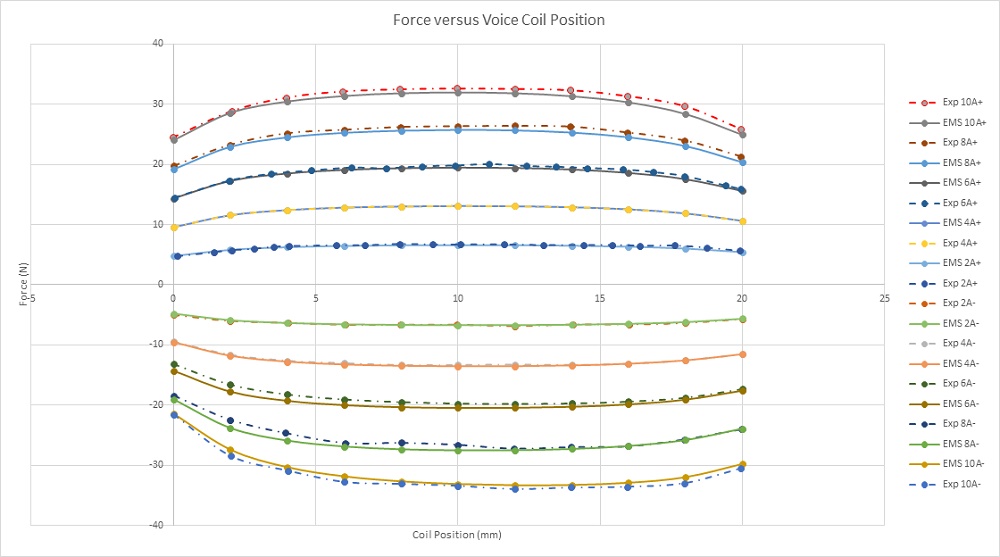
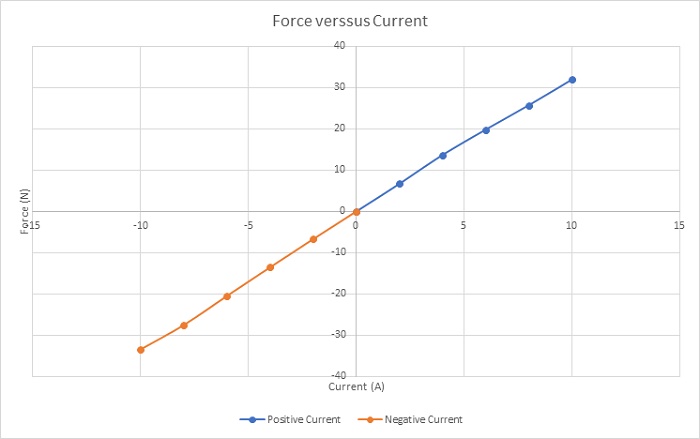
Figure 6 illustrates the force sensitivity parameter for various input currents across the stroke. This parameter remains constant concerning current and depends solely on coil position. The simulated average force sensitivity parameter (computed by EMS) is approximately 3.2N/amp, closely matching the experimentally measured value (Exp 3.1N/amp).
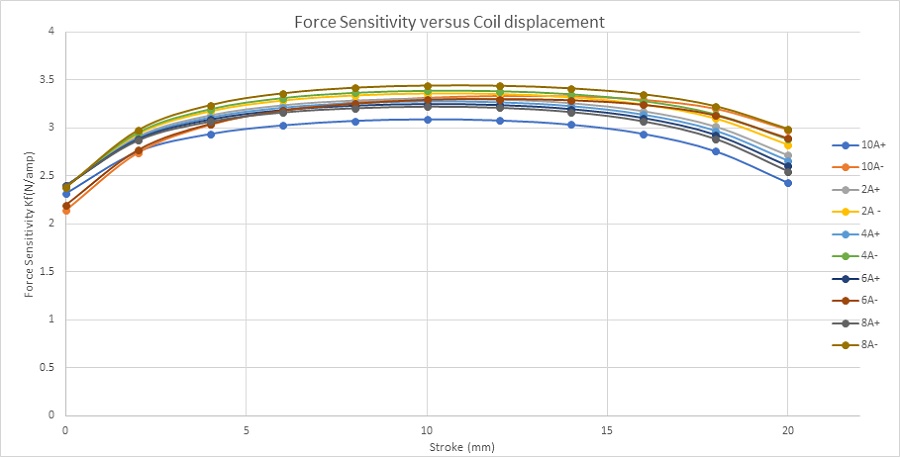
Figure 7 shows the inductance curve versus coil displacement. The inductance decreases from 5mH at 0mm to 4.48mH at 20mm. The variation can be neglected, and the coil inductance can be considered as constant along the stroke.
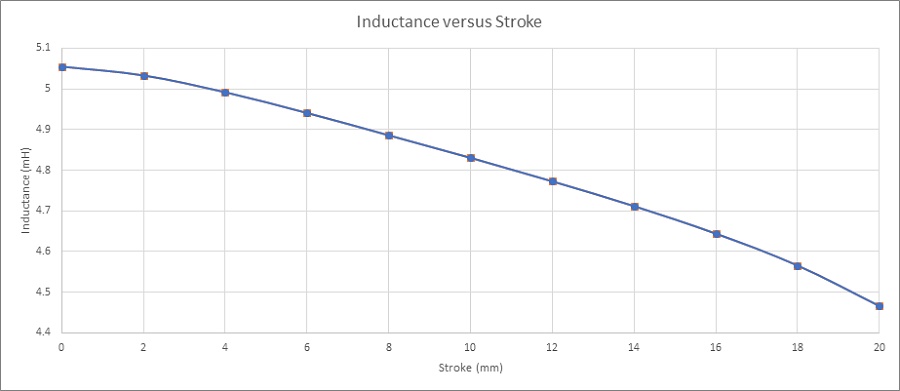
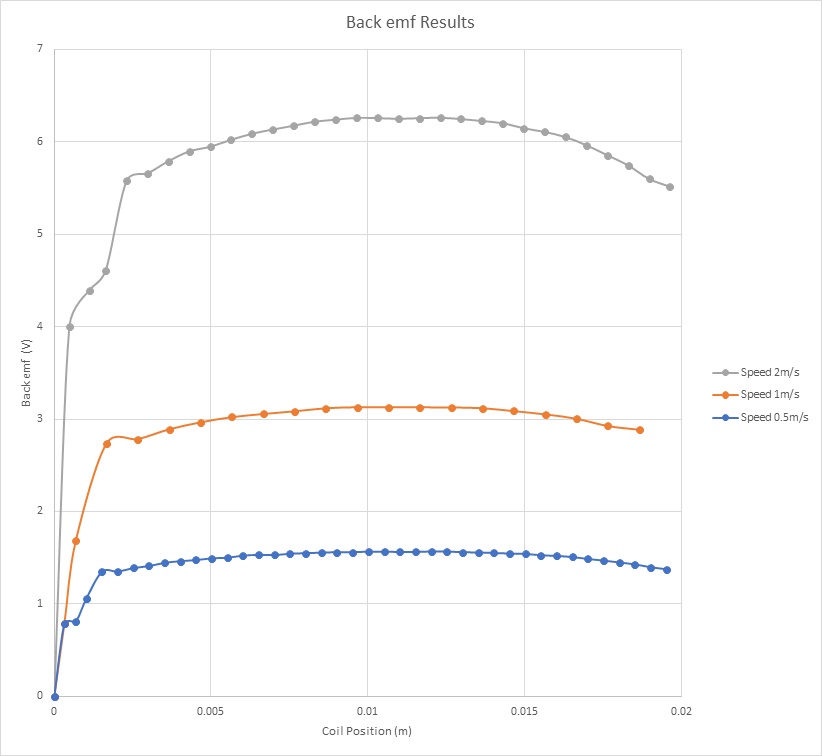
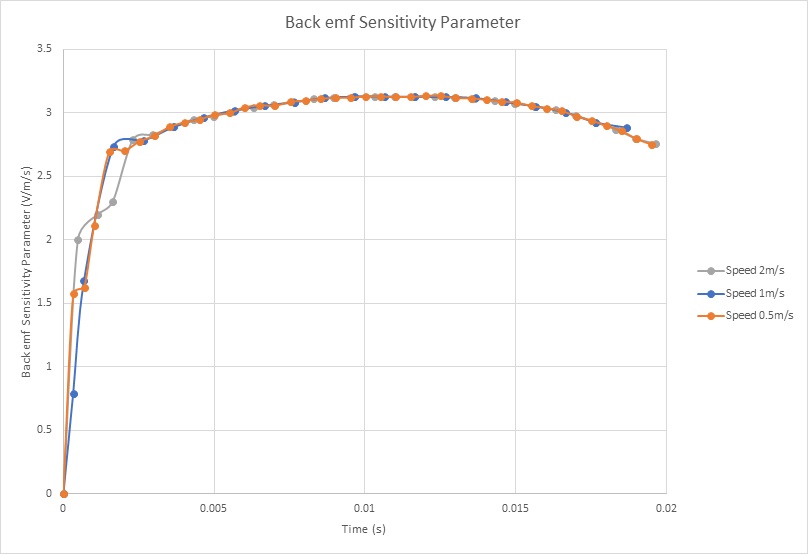
Figure 8 shows the Back emf results of the coil for different velocities versus the center of mass of the moving components. It demonstrates that the Back emf increases with the speed. With a speed of 2m/s, it reaches a peak of 6.25V. Figure 9 contains the computed Back emf sensitivity parameter (V/speed) versus the coil position. It is a speed-constant parameter, i.e. it doesn’t change with the speed of the coil. It can be averaged to 3.1 V/m/s.
| EMS | Experimental | |
| Current | +10 A$$ \mathrel{\mathop{\leq}} I \mathrel{\mathop{\leq}} $$-10A | +10A$$ \mathrel{\mathop{\leq}} I \mathrel{\mathop{\leq}} $$-10A |
| Resistance | 20.35 $$ \Omega $$ | 20.5 $$ \Omega $$ |
| Inductance | 5mH | 5mH |
| Maximum Generated Force | 34N | 33.4N |
| Force Sensitivity Parameter | 3.2N/amp | 3.1N/amp |
| Back emf Sensitivity Parameter | 3.1V/m/s | 3.1V/m/s |
Electro-Mechanical Simulation using EMS – Coil displacement, speed, acceleration and current calculation
In this section, electrodynamic simulation is conducted to calculate and generate electromechanical results, including magnetic fields, current, coil position, speed, and acceleration. The simulation neglects the eddy current effect caused by motion. EMS analysis is utilized for these simulations. Figure 10a) displays a plot of the magnetic flux density at 20ms and 20V, indicating a maximum field (1.77T) located at the thin walls of the iron shell. At this time, the current and position of the coil are 0.88A and 4.78mm, respectively. Figure 10b) presents a plot of the magnetic flux at 9ms and 200V, with peak values reaching about 2T in the iron shell. At this instant, the coil achieves a position of 8.6mm and a current of 9.26A. Magnetic field animations are depicted in Figures 11a) and 11b).
-in%20case-of-20V-b)in-case-of-200V.jpg)
%20.gif)
(a)
.gif)
(b)
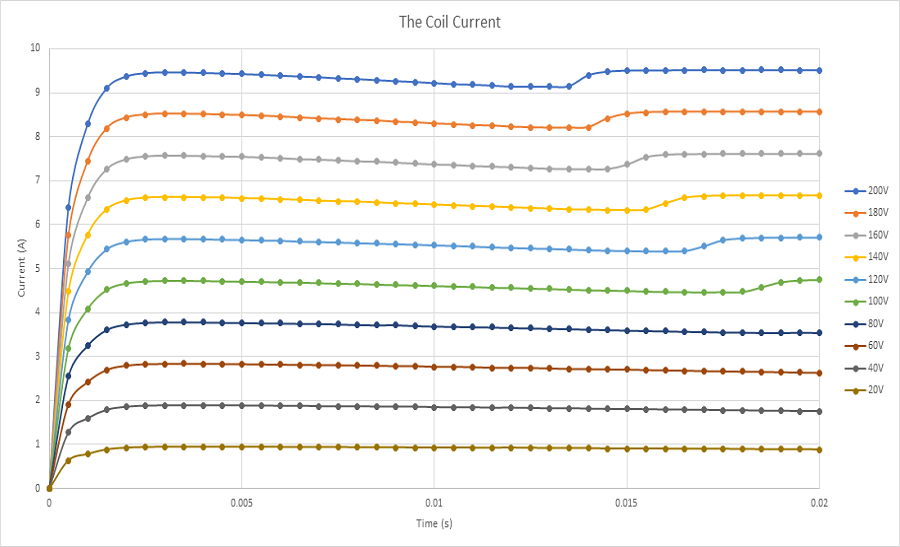
Figures 12a), 12b), and 12c) depict the results of coil linear displacement, speed, and acceleration for various applied voltages. With a DC voltage of 20V, the voice coil actuator moves from 0mm at 0s to 4.7mm at 20ms. The maximum speed achieved by the coil is nearly 0.5m/s, with an acceleration of about 30m/s^2. When a 200V DC voltage is applied, the moving coil travels from 0mm to 20mm in 13 ms, resulting in a maximum speed and acceleration of 3.3m/s and 308m/s^2, respectively. The speed increases with voltage due to the direct proportionality between current and applied voltage, as illustrated in Figure 13. The computed currents in the coil are 9.5A and 0.9A for supplied voltages of 200V and 20V, respectively.
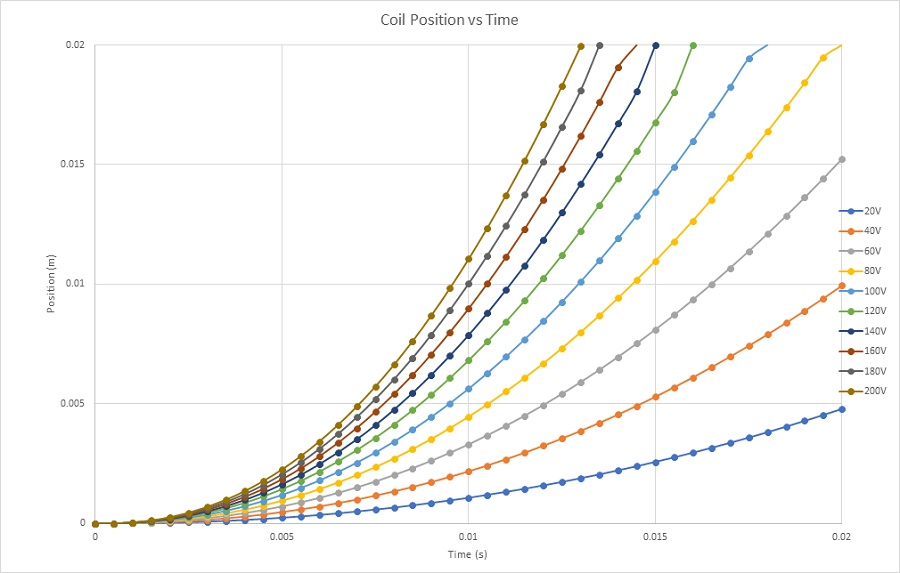
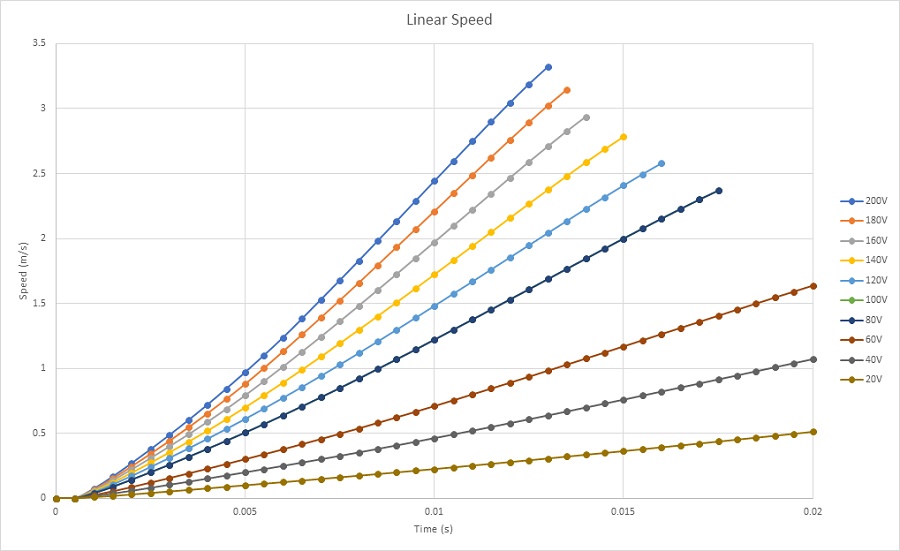
Figure 12b - Coil speed
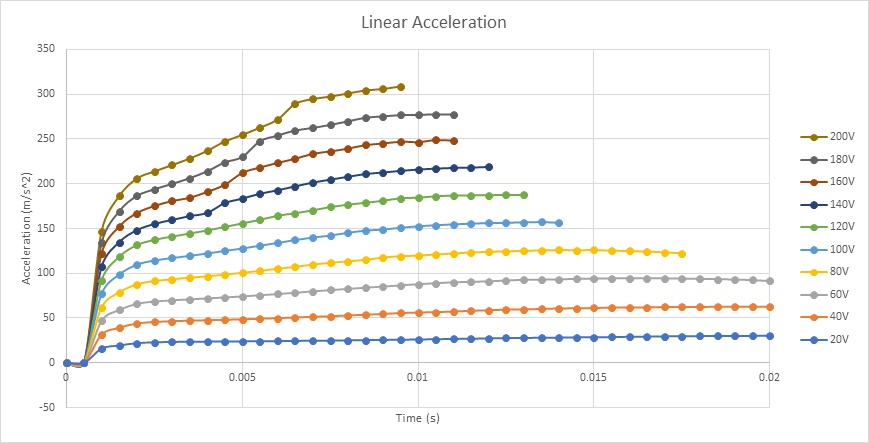
Figure 12c - Coil acceleration
Conclusion
This application note explores the performance of a voice coil actuator, focusing on its optimization for enhanced electromagnetic and mechanical outputs, essential in precision motion applications. Employing EMWorks for static and electrodynamic simulations, the study meticulously evaluates the actuator's response to varying currents and positions, revealing a linear relationship between applied current and generated Lorentz force, with force sensitivity remaining consistent across different currents. The actuator, comprising a stranded copper coil and a neodymium magnet, showcases significant efficiency in converting electrical energy to mechanical force, highlighted by its stable inductance over the actuator stroke and predictable force output for precise control. Electrodynamic simulations further demonstrate the actuator's capability for rapid movement with minimal electrical input, achieving notable speeds and accelerations with varying voltages.
References
[1]: Vahid Mashatan. Design and Development of an Actuation System for the Synchronized Segmentally Interchanging Pulley Transmission System (SSIPTS). Department of Mechanical and Industrial Engineering University of Toronto 2013