Description
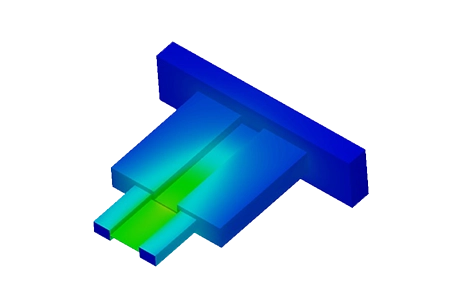
Explore our validated 10-way power combiner simulation, precisely modeled as per [1]. Results closely align with reference measurements, highlighting the accuracy of our simulation. The illustration identifies the main input port (red arrows) and an output port (green arrows).
Figure 1: the structure's 3D view in SolidWorks
Simulation
The Scattering Parameters solver is ideal for analyzing structures like this, providing essential data such as Return Loss, Insertion Loss, Output Port Isolation, and signal phase shifts. It uses a finer mesh at discontinuities and transition faces, crucial for capturing impedance and geometry changes, ensuring high precision in simulations.
Loads/ Restraints
Ports are applied to the circular faces of the dielectrics, with TEM mode propagation indicated to the solver for improved accuracy. The structure functions as a vacuum cavity, with outer surfaces acting as Perfect Electric Conductors.
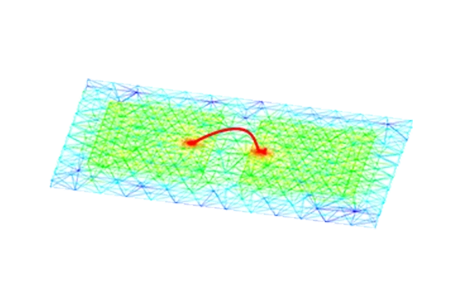
HFWorks allows users to visualize electric or magnetic fields in various formats, offering the flexibility to select the port for excitation. In the highlighted figure, the main central port is activated.
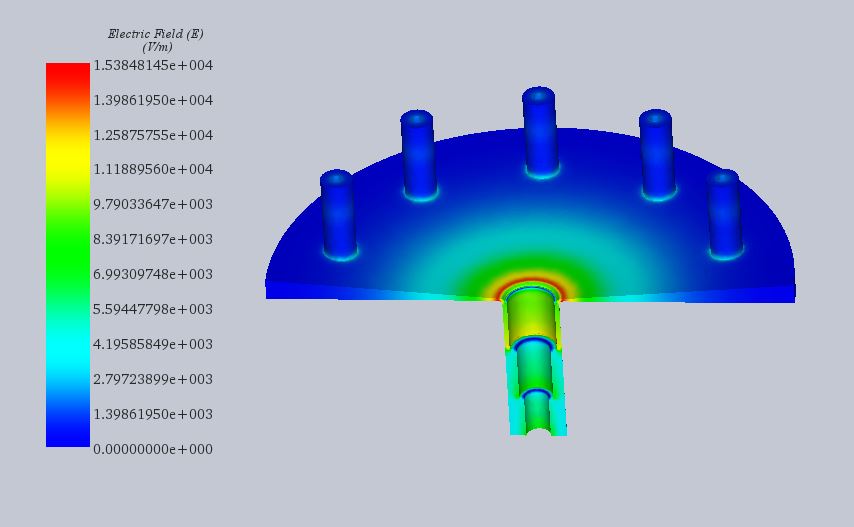
Figure 2: 3D Electric field distribution (Main Central Port is excited)
Results
To confirm HFWorks simulator's accuracy, comparing simulation data with actual measurements is crucial. The accompanying figures detail the structure's insertion and return losses across the 2 to 20 GHz frequency range.
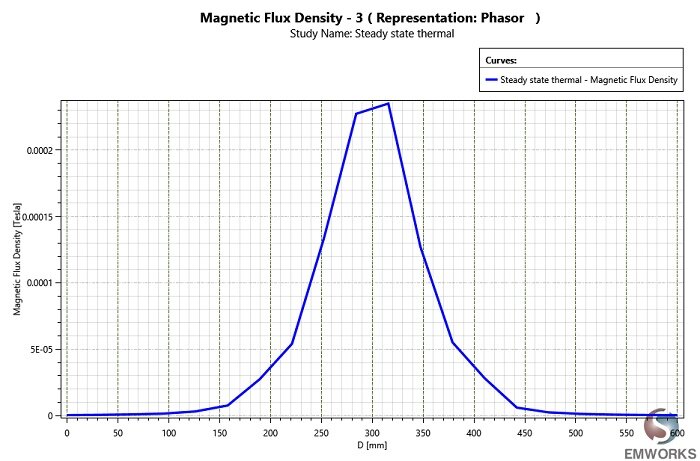
Figure 3: A comparison of the simulated and measured reflection coefficients at the central output port
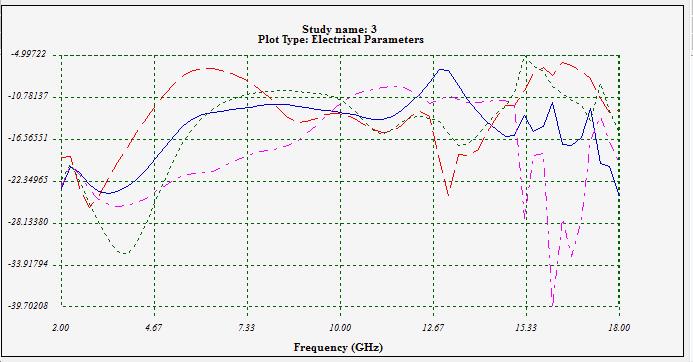
Figure 4: Isolation between the output ports (S23, S24, S25, S26)
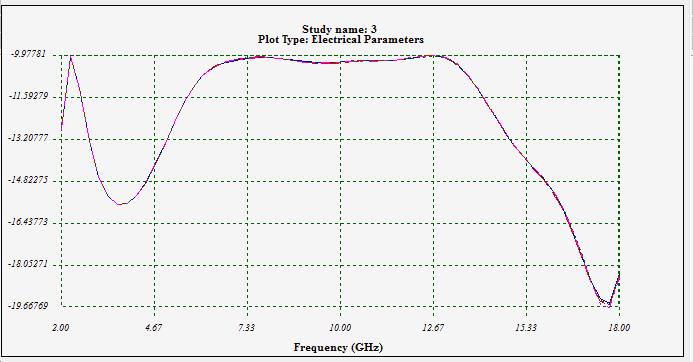
Figure 5: Insertion losses from the main input to port N
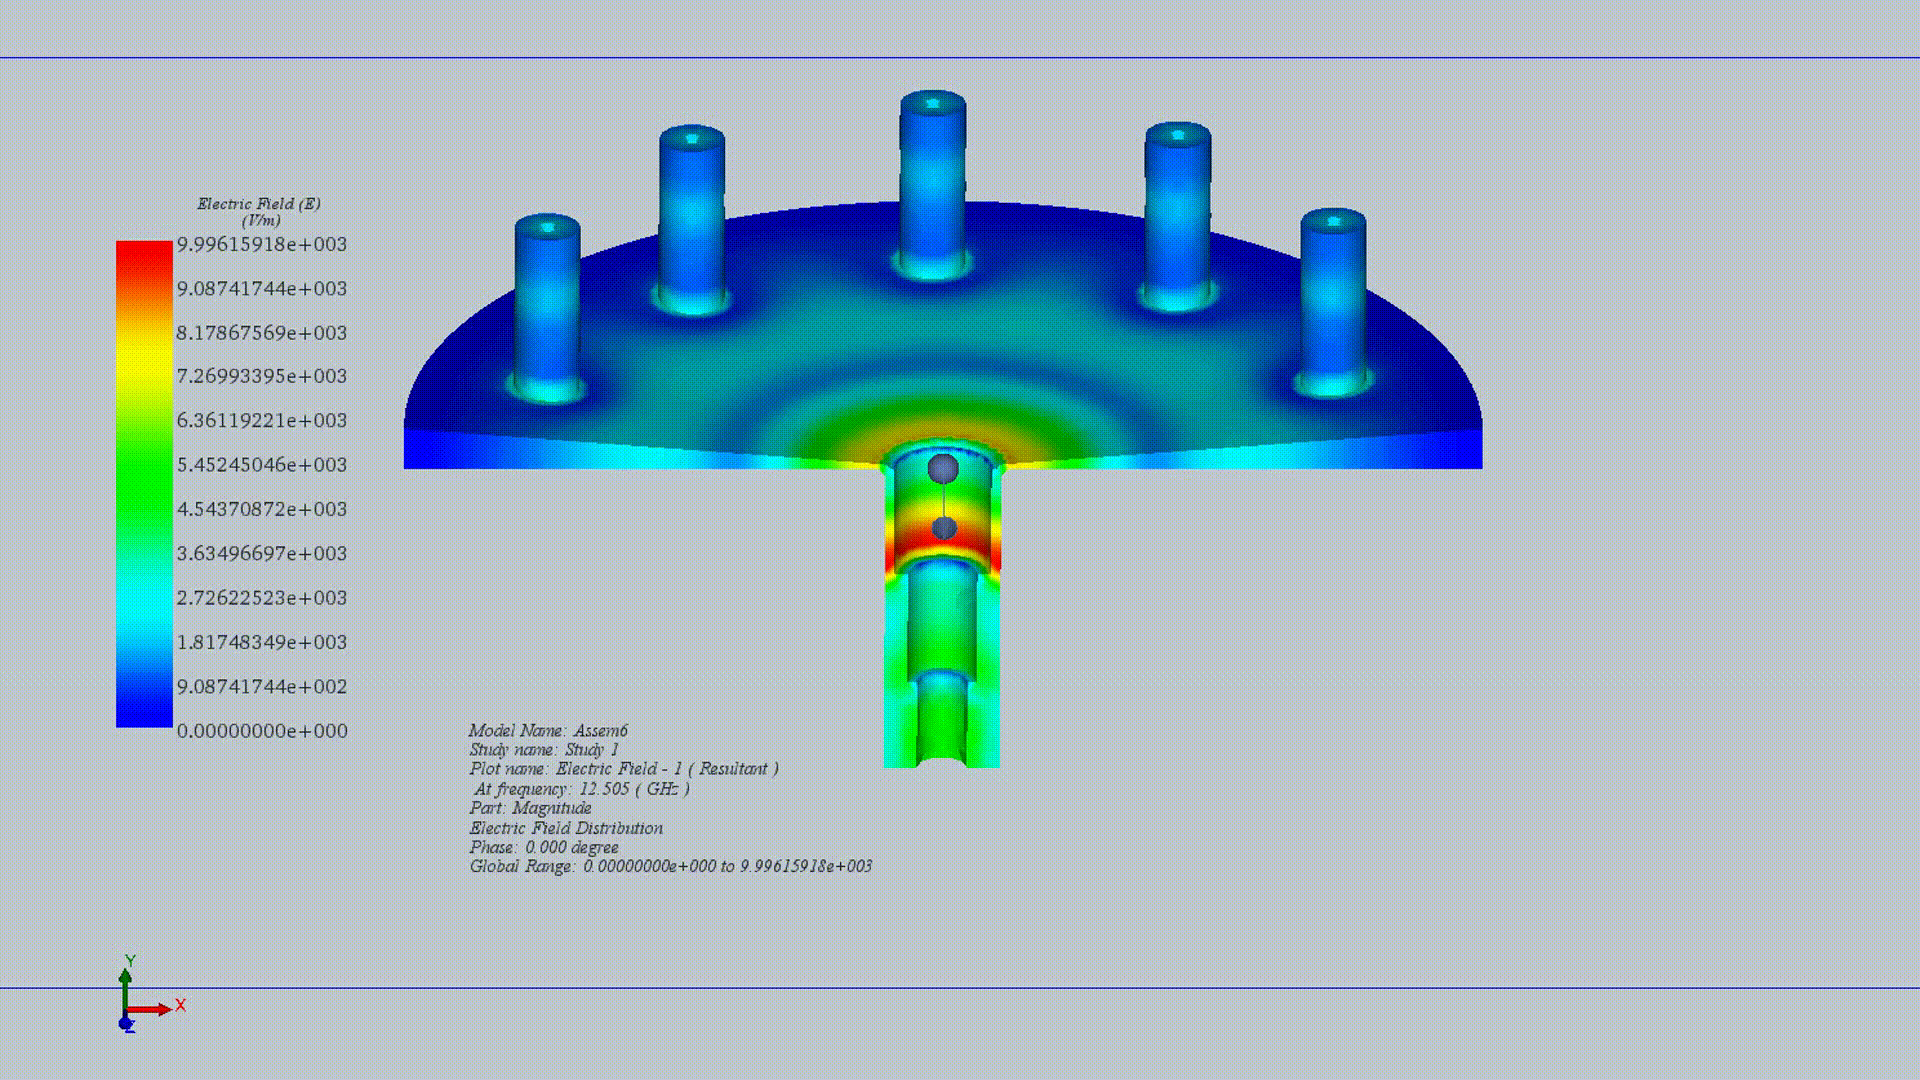
Figure 6: 3D Electric Field Distribution at 3 GHz
Conclusion
This application note provides a comprehensive analysis of a 10-way power combiner simulation, showcasing the precision and reliability of the simulation process in comparison to referenced measurements. The study employs the Scattering Parameters solver to derive essential metrics such as Return Loss, Insertion Loss, Output Port Isolation, and phase shifts, with special attention to mesh refinement at critical points to accurately reflect changes in impedance and geometry. The simulation setup involves applying ports to the dielectric faces and designating the structure as a vacuum cavity, with external surfaces acting as Perfect Electric Conductors. Visualizations of electric or magnetic fields highlight the detailed simulation capabilities, particularly the 3D electric field distribution when the main central port is excited. Results spanning a 2 to 20 GHz frequency range reveal a close match between simulated and measured data for reflection coefficients, port isolation, and insertion losses, affirming the accuracy of the HFWorks simulator. This validation underscores the effectiveness of HFWorks in simulating complex RF structures, contributing valuable insights to the design and analysis of power combiners.
References
[1] Design of a Ten-Way Conical Transmission Line Power Combiner Dirk I. L. de Villiers, Student Member, IEEE, Pieter W. van der Walt, Senior Member, IEEE, and Petrie Meyer, Member, IEEE Feb. 2007.