Introduction
Accurate thermal and mechanical predictions are essential when designing high-current busbars. These conductors often operate close to their thermal, electrical, and mechanical limits, where relatively small design choices—such as spacing, thickness, span length, mounting stiffness, and cooling conditions—can have a disproportionate impact on reliability and safety.
Under nominal current, even moderate temperature rise accelerates insulation aging, increases resistive losses, and reduces long-term reliability. Under short-circuit conditions, electromagnetic forces rise extremely rapidly and can deform conductors within milliseconds, potentially damaging supports, loosening joints, or causing phase-to-phase contact. Evaluating these coupled effects early allows engineers to select geometries and reinforcement strategies that prevent field failures rather than reacting to them after commissioning.
Thermal Analysis at Nominal Current
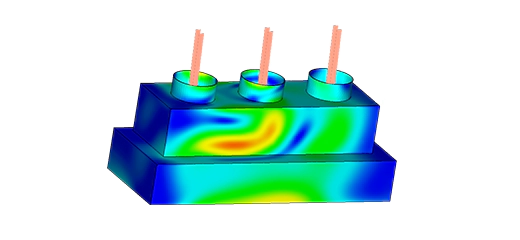
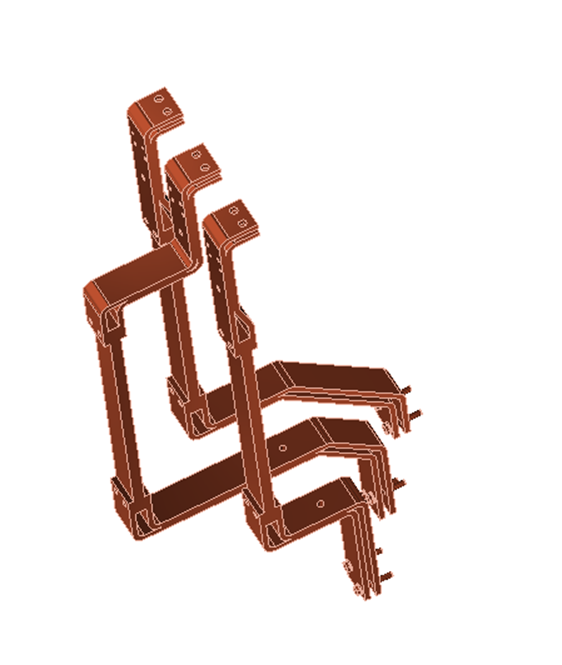
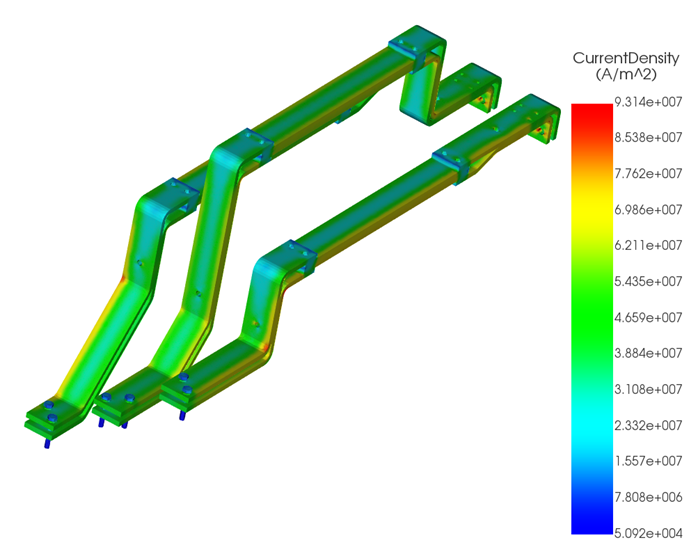
Three parallel copper busbars spaced 70 mm apart were analyzed under a 1600 A AC current, as shown in Figure 1. The resulting current density distribution is shown in Figure 2. Natural convection was assumed, with a heat transfer coefficient of 10 W/m²·K and an ambient temperature of 26 °C.
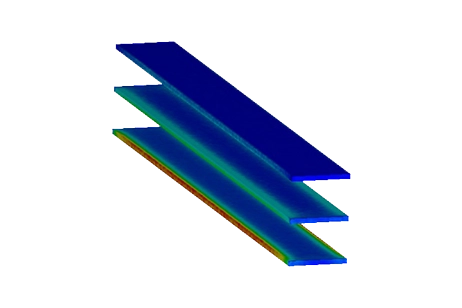
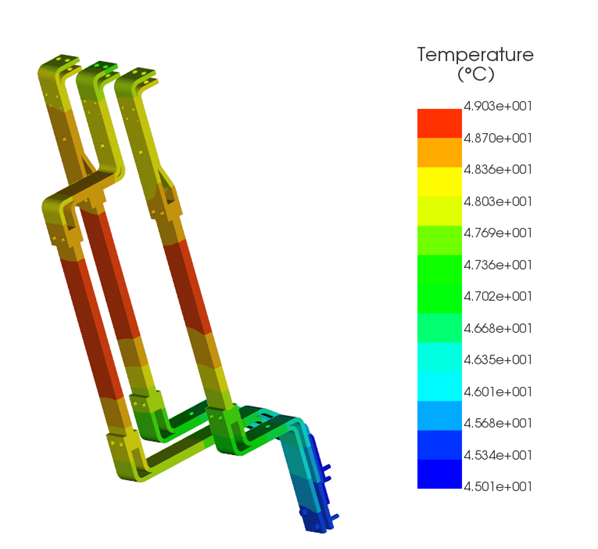
The steady-state temperature field (Figure 3) shows a peak temperature of approximately 49 °C near the center of each bar. This spatial distribution is physically intuitive:
- The bar ends remain cooler due to conductive heat transfer through mounting hardware.
- Edges cool more effectively because of increased exposed surface area.
- The mid-span region experiences the highest temperature because heat has fewer escape paths.
This behavior leads to an important design insight:
In high-current busbars, the hottest region is rarely near the terminals; it is typically located in long, unsupported spans.
As a result, mid-span regions should be evaluated carefully for both steady-state and overload conditions. Although a peak temperature of 49 °C appears acceptable under the assumed conditions, the margin is small. In industrial switchgear environments where ambient temperatures of 40–45 °C are common, this margin can be entirely consumed. Such effects are frequently underestimated until thermal damage appears in service.
Force Density and Mechanical Deformation Under Short-Circuit Forces
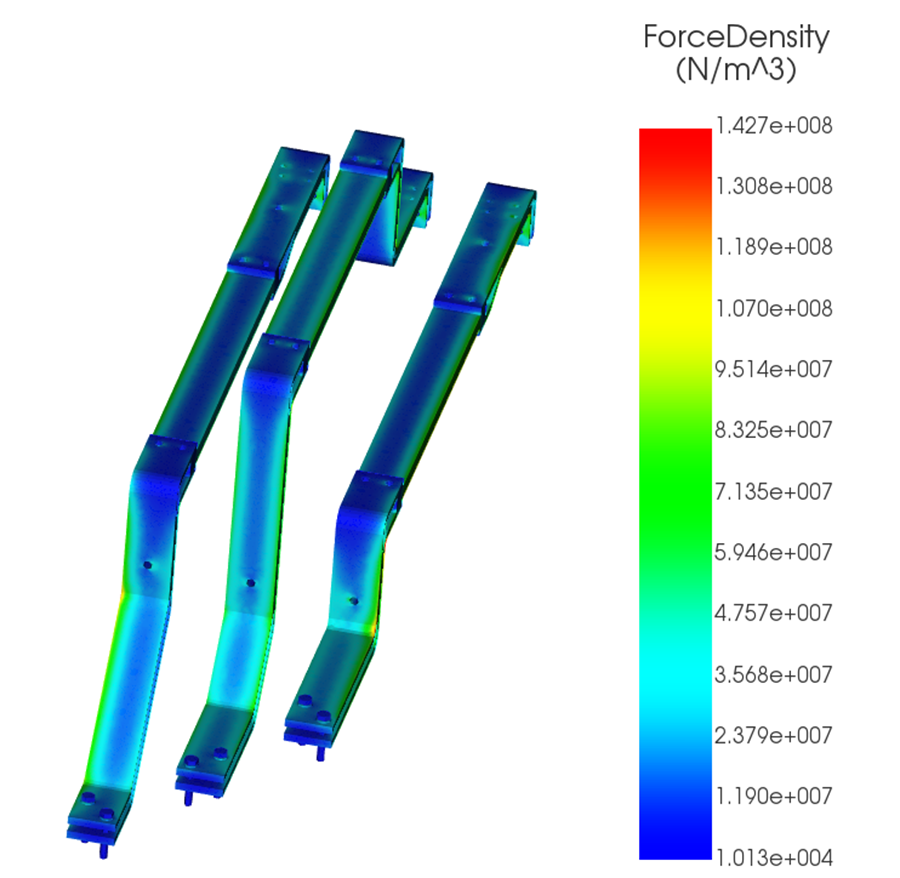
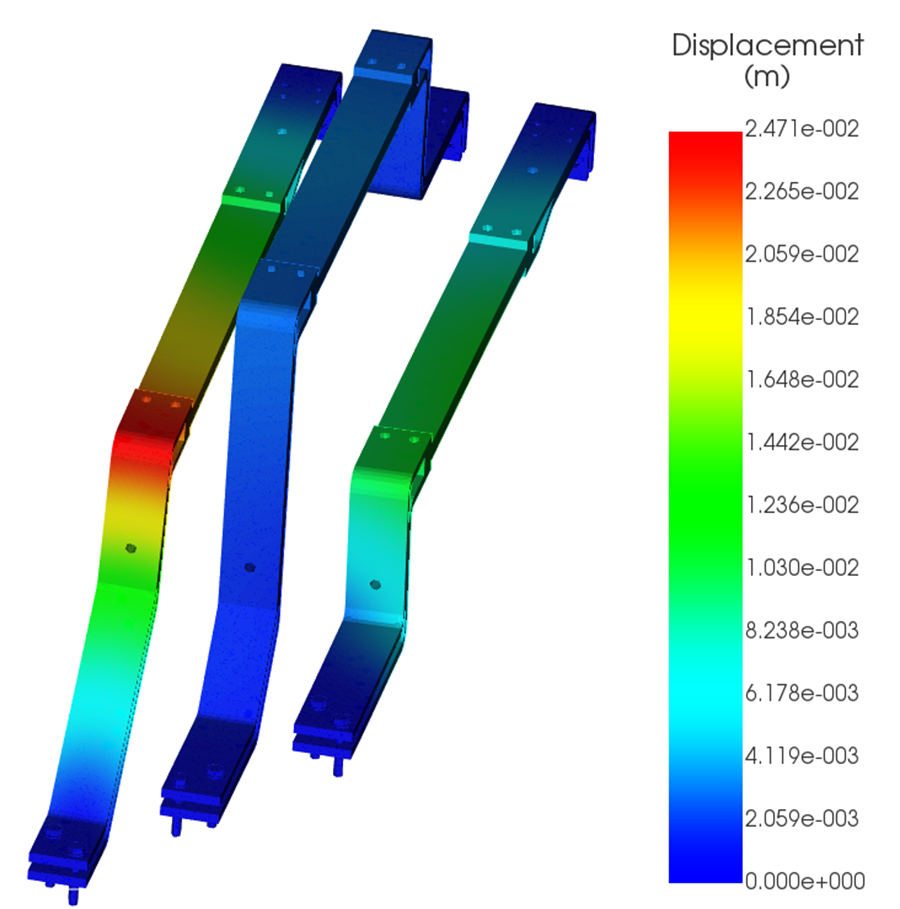
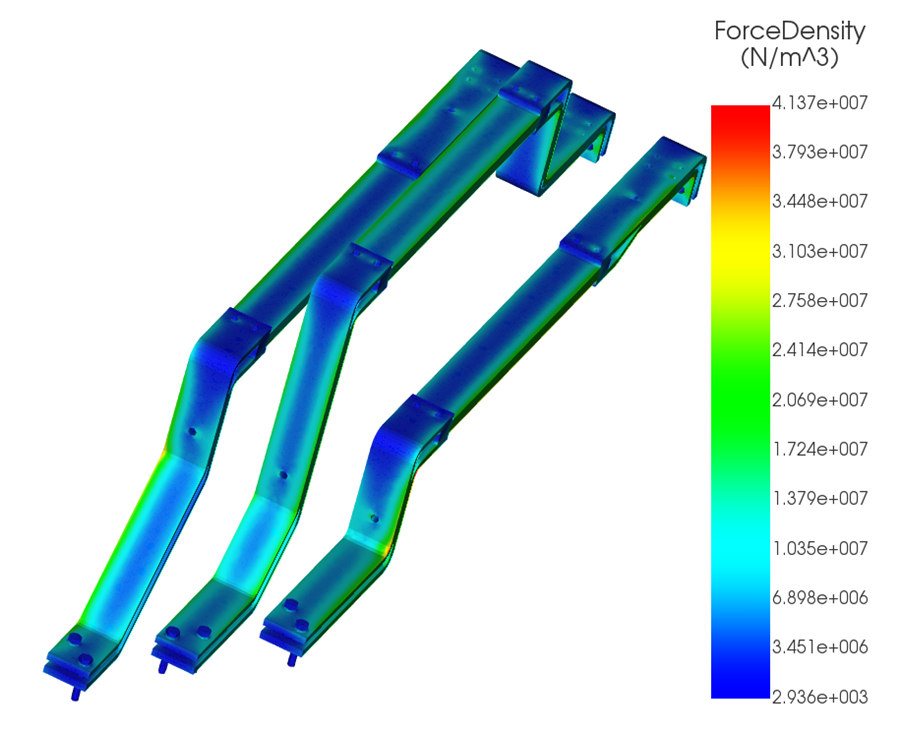
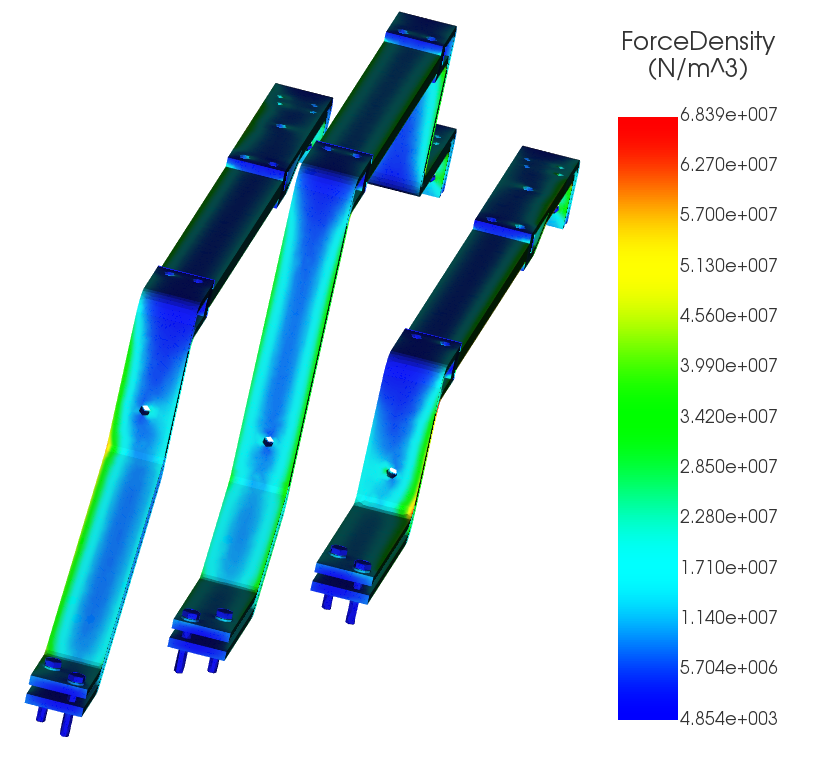
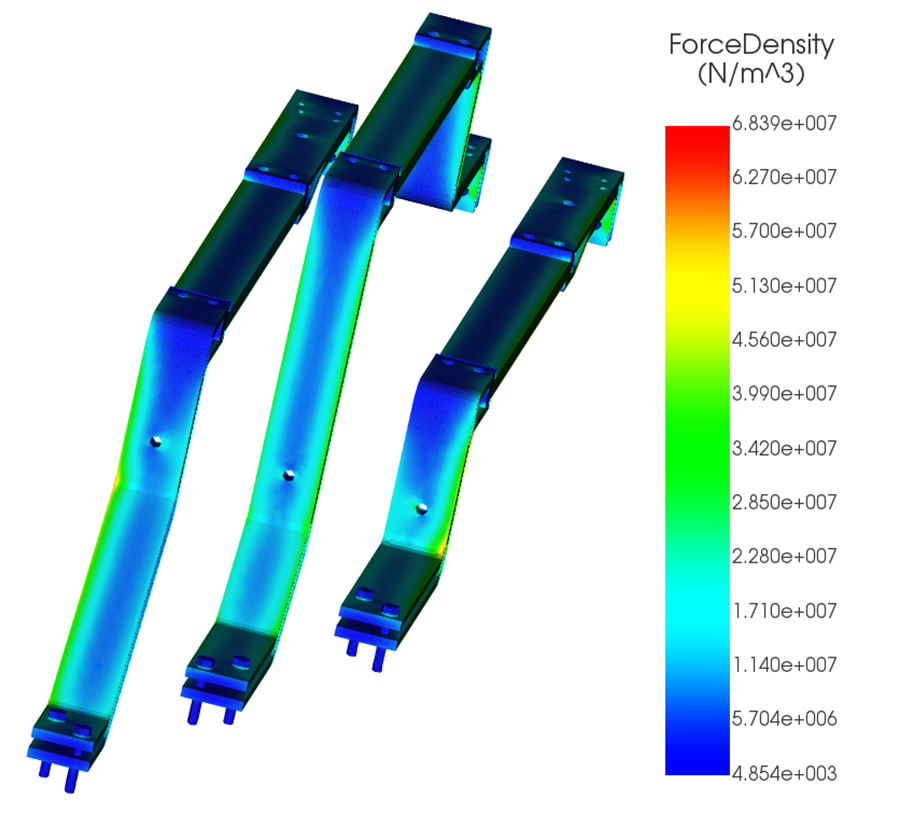
Short-circuit currents of 35 kA, 45 kA, and 65 kA were applied to the same geometry. Because Lorentz forces scale with the square of the current (I²), even moderate increases in fault current can produce disproportionately large mechanical loads. The resulting force density and structural displacement are shown in Figures 4–9.
The table below summarizes the peak force density and maximum displacement for each case:
| Short-Circuit Current (A) | 35 000 | 45 000 | 65 000 |
|---|---|---|---|
| Max force density (N/m3) | 4.13e+07 | 6.83e+07 | 14.27e+07 |
| Max displacement (cm) | 7.16 | 11.8 | 24.71 |
Two engineering observations are particularly important.
1. Force Density and Displacement more than triples between 35 kA and 65 kA
Although the short-circuit current increases by less than a factor of two from 35 kA to 65 kA, the force density and displacement increase by more than a factor of three. This behavior arises from two effects:
- Electromagnetic force increases quadratically with current, as shown in Figure 4.
- Structural deflection increases nonlinearly once the system begins to lose effective stiffness under load.
This exposes a common misconception:
Busbars that appear mechanically rigid during normal operation can behave as highly flexible structures during fault events.
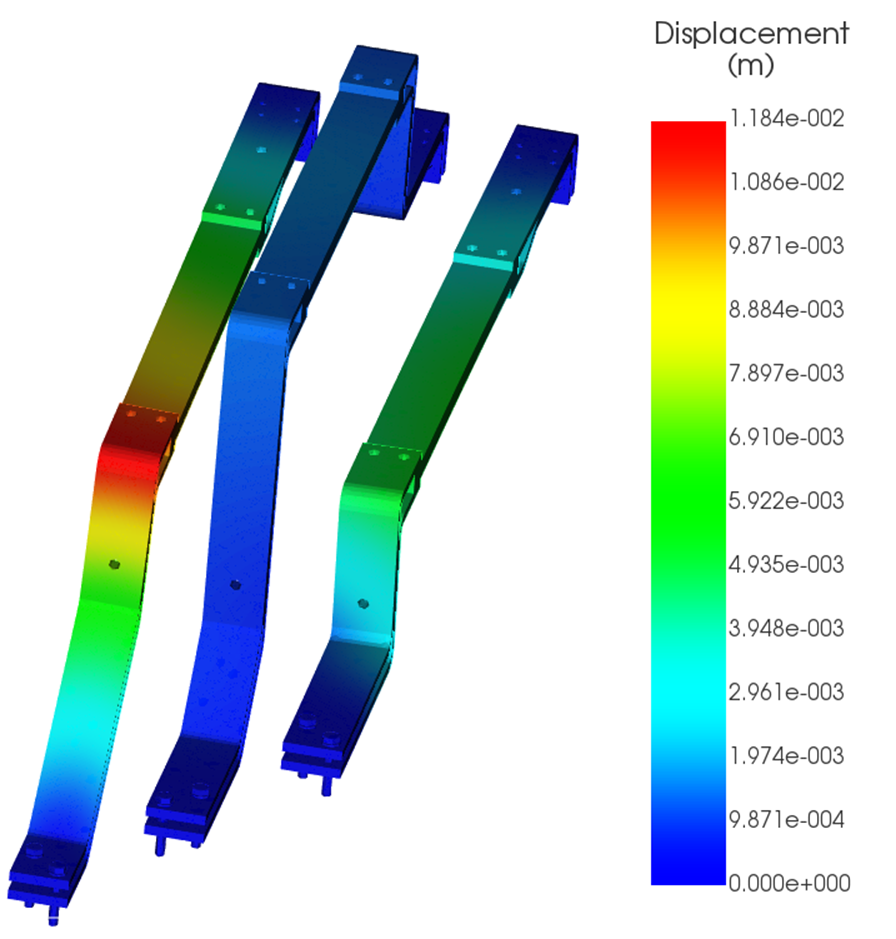
2. A 25 cm displacement at 65 kA is unacceptable without reinforcement
At the highest fault level, the predicted displacement presents a serious safety risk. Potential failure modes include contact between adjacent phases, fracture of insulating supports, loosening or failure of bolted connections, and initiation of arcing or secondary faults.
These results emphasize the need for shorter unsupported spans, rigid and well-distributed supports, strategic bracing near mid-span regions, and accurate short-circuit withstand evaluations early in the design process.
What the Engineer Should Take Away
This case demonstrates several practical lessons for busbar design:
Thermal Insights
Mid-span heating, not terminal heating, often defines the thermal limit.
Small increases in ambient temperature can eliminate thermal safety margins.
Enclosed or poorly ventilated installations significantly reduce effective convection and must be modeled accordingly.
Mechanical Insights
- Lorentz forces scale with I²; even modest errors in assumed fault current can lead to large underpredictions of displacement.
- Support stiffness plays a critical role and can dominate over conductor geometry.
- Short-circuit forces may excite transient vibrations that persist beyond the fault duration.
Design Insights
- Thermal and electromechanical analyses must be performed together; evaluating one without the other is incomplete.
- Reinforcement should focus on mid-span regions where both temperature and displacement peak.
- Relatively simple changes in geometry or mounting strategy can dramatically reduce both temperature rise and mechanical deformation.
Conclusion
Temperature rise and short-circuit-induced deformation are two facets of the same design challenge. This study shows that both effects concentrate in the same physical region of the busbar—the mid-span—making it the most likely failure location. Performing coupled thermal and mechanical simulations early in the design process provides a realistic assessment of operating margins and helps prevent unexpected failures during testing, commissioning, or service.
All simulations in this study were performed using EMWorks EMAG on the same 3D busbar CAD model.