PMBLDC
Permanent magnet brushless DC motors (PMBLDC) find extensive use across various applications due to their high-power density and ease of control. Specifically, outer runner PMBLDC motors are employed in direct drive wind turbines and small electric vehicles like golf cars and electric bikes, eliminating the necessity for mechanical transmission or gearboxes. This enhances overall system efficiency, leading to extended battery life. In this application note, we evaluate the performance of an outer-runner radial flux BLDC motor featuring surface-mounted permanent magnets, utilizing EMWorks2D software.
Case Study
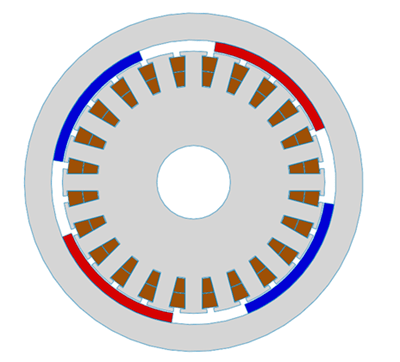
The motor is an out-runner radial flux BLDC motor with 24 slots of the stator and 4 poles of rotor placed on the surface of the rotor. Figure 1 illustrates a 2D model of the machine.
The materials used are shown in Table I.
|
Motor Component |
Selected Material |
|
Stator and Rotor |
Electrical Steel M19 |
|
Winding |
Copper |
|
Permanent Magnet |
NdFeB:N4212 |
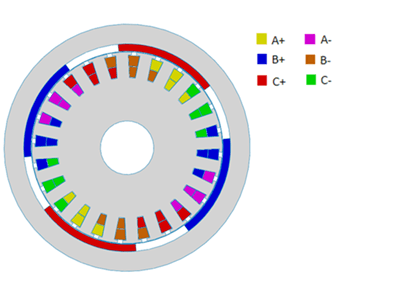
The machine is equipped with a double layer shorted-pitch winding, which has 39 turns per coil, as shown in Figure 2.
Analysis Results
In this section, different analyses are performed using EMWorks2D to evaluate the performance of the machine.
No-Load Results
Using a no-load analysis, the back EMF and flux linkage are computed at the desired speed of 1500 RPM. For this purpose, the simulation is run for one period of back EMF or flux linkage waveform, which in this case is 20 ms, considering the speed and number of poles. The results are shown in Figures 3 and 4 where the phase back EMF has a maximum value of around 250 V. Although the flux linkage shows a smoother waveform close to the sinusoidal waveform, the back EMF waveform has some distortions due to the effect of slots.
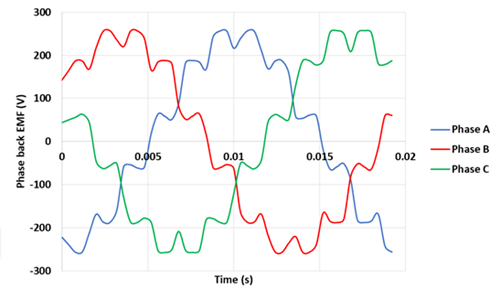
Figure 3 – Three-phase back EMF vs time
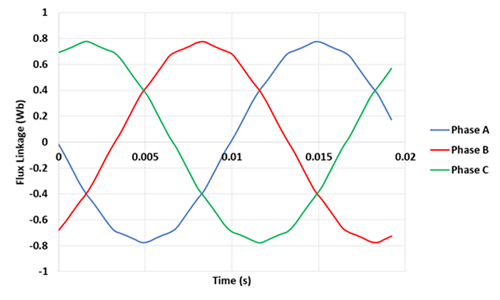
Fig. 4. Three-Phase Flux Linkage Curve vs Time
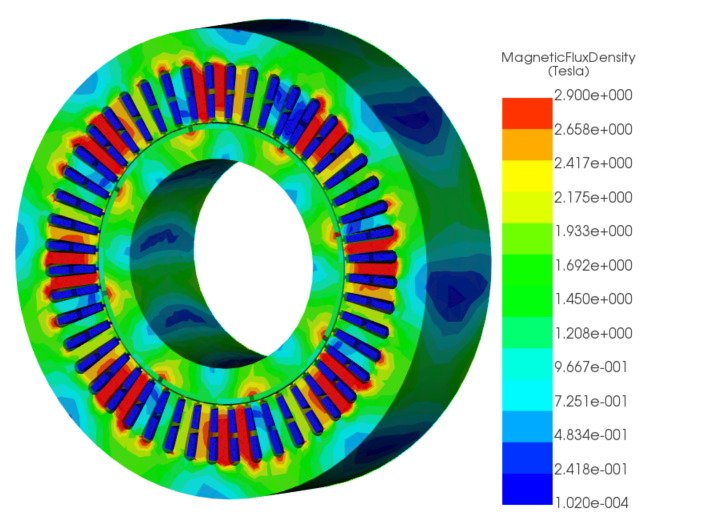
The magnetic flux mapping of the outer-rotor type motor, which is just one of the numerous results provided by EMWorks2D, is shown in the following figure, for an angular position of 90 degrees at t=10ms.
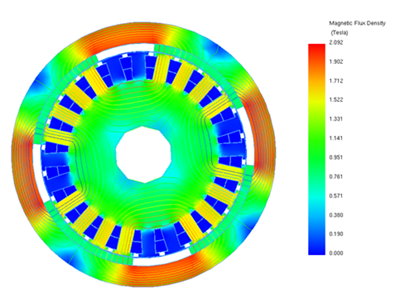
Fig. 5. Magnetic Flux Distribution Under No-Load Conditions
The cogging torque is another parameter that can be obtained via a no-load analysis. The cogging torque period is normally equal to one slot pitch; therefore, it is recommended to run the no-load analysis with smaller steps to achieve a good resolution of cogging torque. Figure 6 shows the cogging torque versus the mechanical angle in degrees.
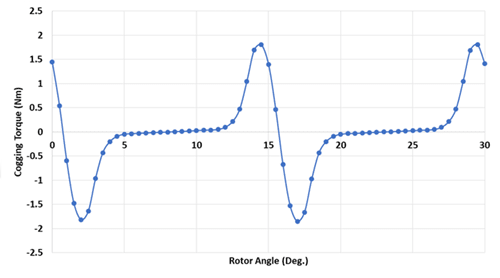
Fig. 6. Cogging Torque
On-Load Results
The second simulation results part is dedicated to the on-load case where the capability of torque generation of a machine at a certain voltage or current is examined. A three-phase sinusoidal voltage is applied to the windings with a maximum value of 250 V and a frequency of 50 Hz. This frequency is equivalent to the speed of 1500 RPM. The resulting computed torque for four successive periods of 80ms is shown in Figure 7. The torque curve has a transient behavior in the beginning and then it reaches a steady state situation where it oscillates around an average value of 35 Nm.
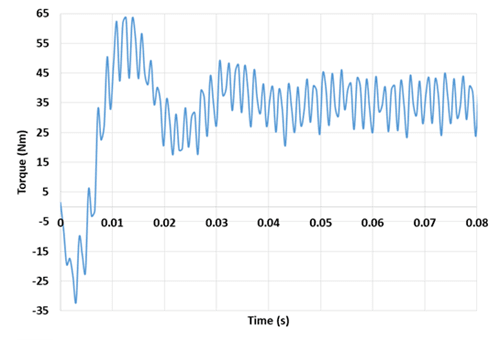
Fig. 7. On-Load Torque
The core loss results are computed for both the rotor and stator cores versus time, shown in Figure 8. The core loss in the stator is relatively higher than the core loss in the rotor for most of the time.
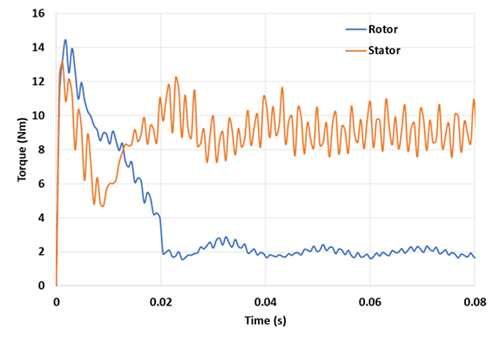
Fig. 8. Core Loss Curves vs Time for Rotor and Stator Parts
The magnetic flux density distribution of on load conditions at different steps is animated in Figure 9.
Generator Analysis
The final part is dedicated to studying the generator mode. This kind of generator is widely used for direct drive wind turbine applications. The integrated circuit simulator of EMWorks2D is coupled to the transient motion analysis to connect three symmetric resistive loads, of 25 ohms, to the three-phase winding system as shown below.
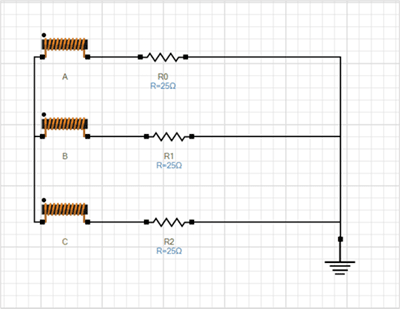
Fig. 10. Modeled Circuit of the Generator Windings and the Connected Loads
The simulation was conducted at 1500 rpm. The results are shown in Figures 11 and 12. Based on these results, the generator produces an EMF, i.e. the induced voltage, closer to the sinusoidal wave. The reader may ask how this waveform is different from the back EMF achieved by the no-load analysis. The answer is that the current flowing through the phases cannot be changed instantly due to the presence of winding inductance. This causes a smoother waveform at loaded generating conditions.
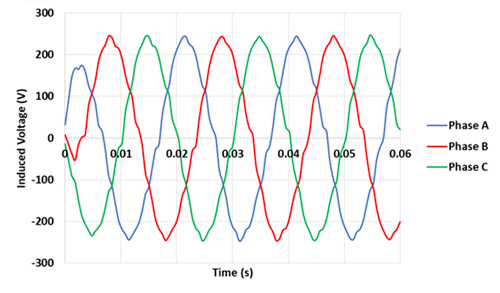
Fig. 11. Induced Voltage vs Time- 1500 rpm Speed
Figure 12 shows the load current which has a similar waveform to the EMF waveform due to the resistive load.
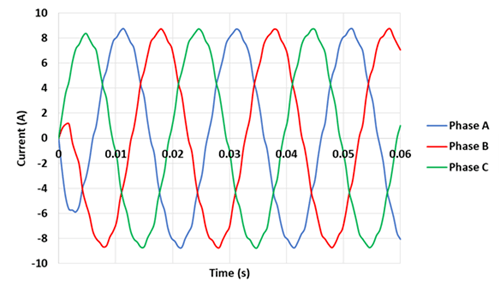
Fig. 12. Induced Current vs Time- 1500 rpm Speed
As shown in Figure 13, the torque is negative and oscillates around -20 Nm, as expected for the generator mode.
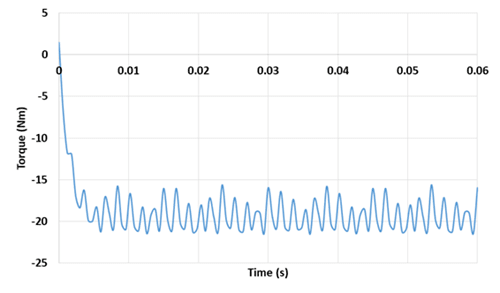
Fig. 13. Generator Torque for 1500 rpm Speed
Conclusion
In this application note, a 2D design of an Out-runner Permanent Magnet machine is studied using EMWorks2D simulation. Both, motor, and generator modes were explored using transient motion module and circuit simulator for no-load and on-load analyses. Several design insights can be concluded from this study. For example, there are significant differences between on-load and no-load modes of operation for both electrical and mechanical output parameters. In addition, the motor and the generator modes are also quite different.
References
Chasiotis, Ioannis D., and Yannis L. Karnavas. "A computer aided educational tool for design, modeling, and performance analysis of Brushless DC motor in post graduate degree courses." Computer Applications in Engineering Education 26.4 (2018): 749-767.