Introduction
This application note analyzes the electromagnetic behavior of a Permanent Magnet Synchronous Motor (PMSM) subjected to a stator inter-turn short circuit (ITSC) under stationary (locked-rotor) conditions. Finite element modeling (FEM) is used to study a fault affecting 25% of one phase winding. The results show that this localized defect does not remain electrically confined to the damaged turns, but instead alters the global magnetic behavior of the machine.
The shorted turns form a closed conductive loop that is magnetically coupled to the energized stator windings and behaves as a parasitic secondary winding. Through transformer action, large circulating currents are induced in this loop, generating dominant counter-MMF. This mechanism leads to suppression of normal flux paths, collapse of mutual inductive coupling, induced-voltage reduction in healthy phases, negative-sequence field formation, and distortion of torque production. The ITSC therefore manifests primarily as a magnetic coupling and flux-network problem, rather than a simple resistive or electrical short-circuit fault.
Simulation Methodology and Model Configuration
Machine Topology
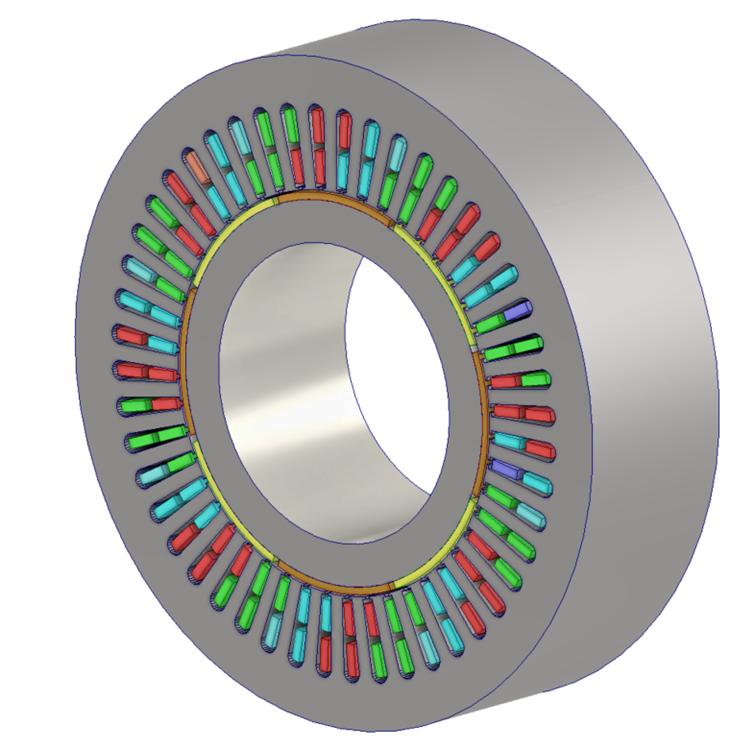
The investigated system is a high-pole-count PMSM with 16 poles, 32 coils per phase, and distributed three-phase stator winding with surface-mounted permanent magnets, as shown in Table 1.
| Category | Parameter | Value |
| Topology | Machine type | PMSM (Surface-mounted PM) |
| Topology | Pole count | 16 (8 pole pairs) |
| Topology | Phase count | 3 |
| Topology | Slots | 48 |
| Stator | Outer diameter | 269.24mm |
| Stator | Inner diameter | 161.9mm |
| Stator | Stack length | 75mm |
| Rotor | Rotor outer diameter | 154.3mm |
| Rotor | Inner diameter | 120.06mm |
| Airgap | Airgap length | 3.8mm |
| Magnets | Magnet material | NdFeB (N42) |
| Magnets | Remanence | 1.55T |
| Magnets | Coercivity | 900000 A/m |
| Windings | Coils per phase | 32 |
| Windings | Turns per coil | 320 |
| Fault Model | Shorted coils | 8 (Phase A) |
| Fault Model | Fault severity | 25% of Phase A |
Electrical Excitation
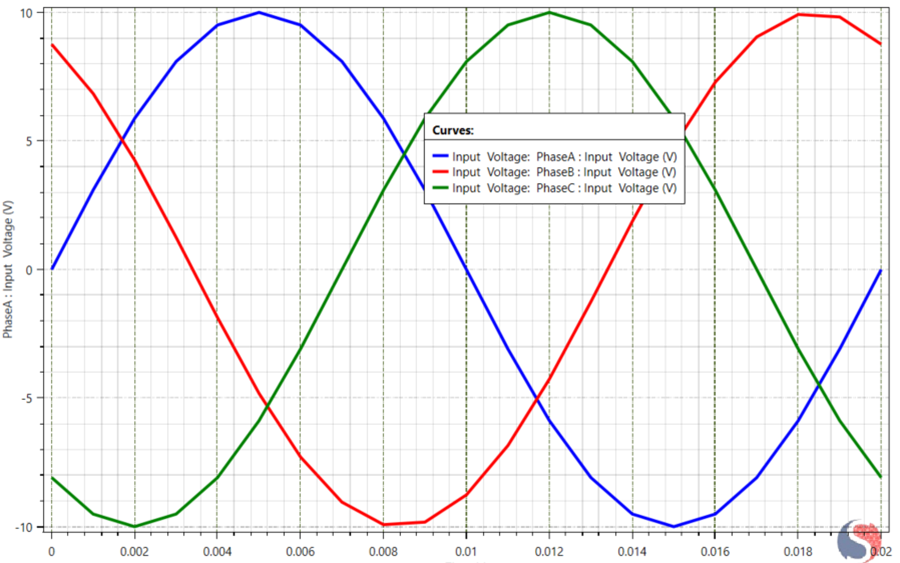
Balanced sinusoidal three-phase voltage excitation is applied to the stator windings under locked-rotor conditions in order to fully suppress rotational back-EMF and isolate the pure transformer-coupled electromagnetic response of the system. The phase voltages are defined as:
This configuration isolates pure transformer-coupled electromagnetic behavior, eliminating effects from rotor motion and electromechanical energy conversion. The stator therefore behaves as a magnetically coupled multi-winding transformer system, enabling direct observation of fault-induced flux redistribution, magnetic suppression, and mutual inductance collapse (Figure 2).
Fault Modeling (ITSC Representation)
As shown in Figure 3, eight coils belonging to Phase A are electrically isolated from the supply and interconnected to form a closed conductive loop with negligible external impedance, with no applied voltage ( Vapplied = 0 ) . This loop behaves as a magnetically coupled parasitic secondary winding, fully linked to the main stator flux. Under AC excitation of the healthy windings, it supports large transformer-induced circulating currents, which generate dominant counter-MMF through Lenz’s law, fundamentally altering the mutual flux distribution and electromagnetic coupling within the machine.
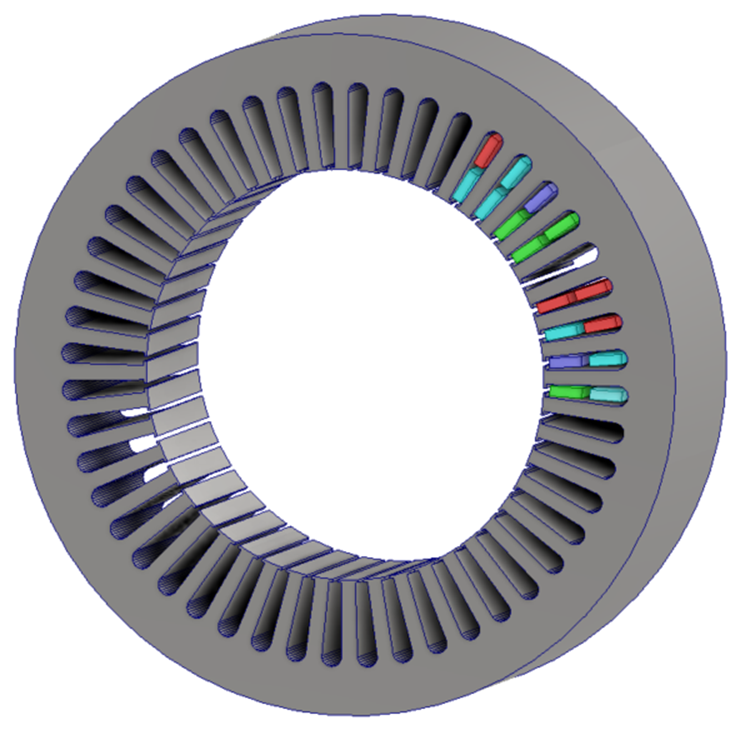
Figure 3: Short-Circuit Coils
Electromagnetic Consequences
Phase Currents

Phase A: Figure 4 shows the Phase A current response. The blue curve represents the healthy machine response, while the red curve corresponds to the case with inter-turn short circuit. The faulted condition exhibits a clear increase in peak current amplitude and waveform distortion due to the reduction in effective phase inductance and the presence of a low-impedance parasitic short-circuit loop.
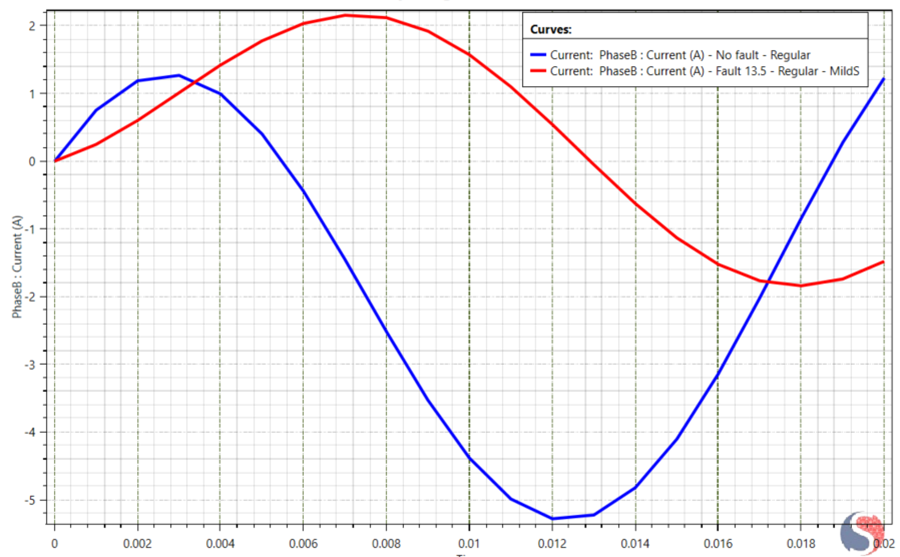
Phase B: Figure 5 shows the current response from Phase B. The blue curve represents the healthy machine response, while the red curve corresponds to the case inter-turn short circuit. Unlike the faulted phase, Phase B does not exhibit current amplification; instead, the current amplitude collapses and the waveform undergoes a strong phase shift. This behavior reflects the suppression of mutual inductive coupling caused by dominant counter-MMF generated in the shorted-turn loop, which magnetically isolates the healthy phase from the main flux network.
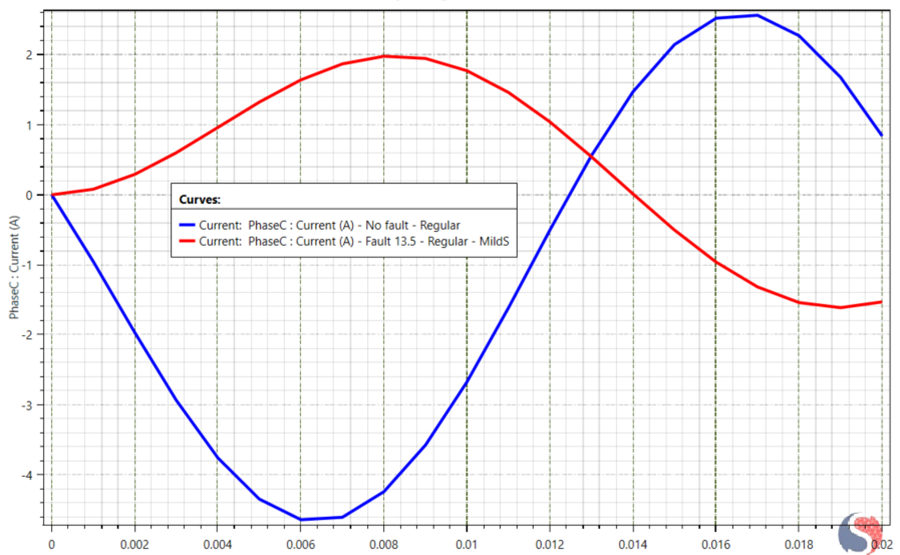
Phase C: Figure 6 shows the current response from Phase C. The blue curve represents the healthy machine response, while the red curve corresponds to the case with inter-turn short circuit. Similar to Phase B, Phase C exhibits a pronounced collapse in current amplitude and significant phase displacement under fault conditions. This response reflects the suppression of mutual magnetic coupling caused by dominant counter-MMF generated in the shorted-turn loop, which magnetically decouples the healthy phase from the main flux network and disrupts the normal three-phase electromagnetic symmetry.
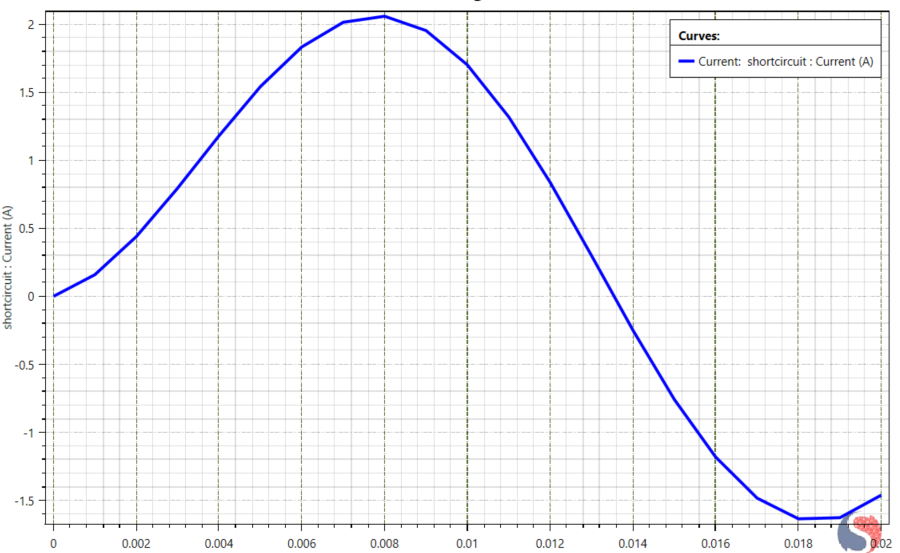
Fault Current: Figure 7 shows the current induced in the eight shorted coils of Phase A forming a closed conductive loop. This current is not supply-fed, but is generated exclusively through transformer action due to magnetic coupling with the energized stator windings. The low-impedance nature of the closed loop enables large circulating currents to develop, which produce dominant counter-MMF through Lenz’s law. This parasitic current constitutes the primary source of magnetic suppression, flux trapping, and mutual inductance collapse observed in the healthy phases.
Negative Sequence Current
The negative-sequence current is:
$$
I_{-2} = \frac{1}{3} \left( I_{-a} + a^2 I_{-b} + a I_{-c} \right)
$$
Where \( a = e^{j120^\circ} = -\frac{1}{2} + j\,\frac{\sqrt{3}}{2} \) and \( a^2 = e^{j240^\circ} \)
The negative-sequence current I2 rises from approximately zero in the healthy state to 2.41 A under fault conditions, indicating the formation of a strong counter-rotating magnetic field due to transformer-induced circulating currents in the shorted-turn loop. This reflects a collapse of magnetic symmetry and mutual inductive coupling, with the unbalance ratio I2 / I1 > 40% confirming a severe electromagnetic failure rather than simple electrical unbalance.
Magnetic Suppression
Induced voltages and flux linkage in healthy phases collapse due to dominant counter-MMF, resulting in magnetic insulation.
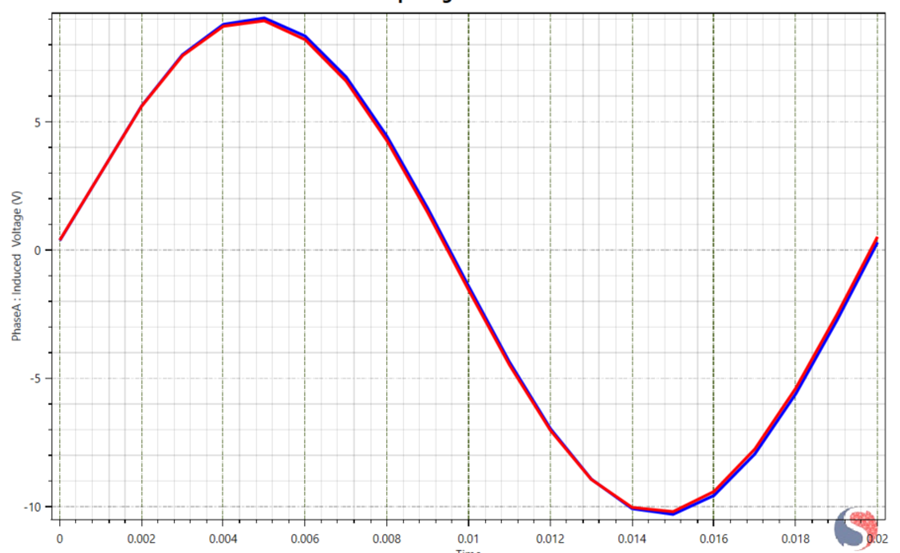
Figure 8 shows the Induced voltage in Phase A under balanced sinusoidal excitation for healthy and ITSC conditions. The blue curve corresponds to the healthy machine, while the red curve represents the case with inter-turn short circuit. The waveform shape and amplitude remain largely preserved, indicating that the local flux in the faulted phase is not suppressed but instead strongly redistributed through transformer coupling with the shorted-turn loop.
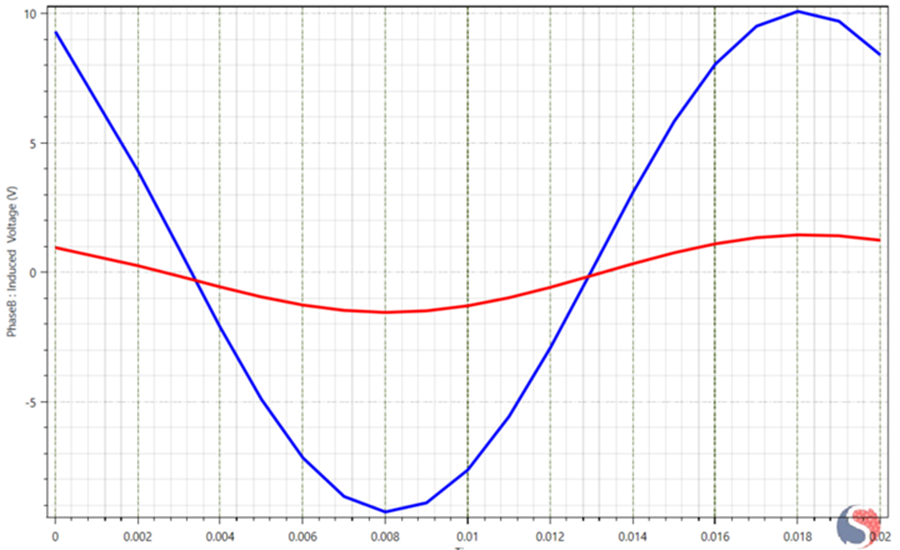
Figure 9 shows the Induced voltage in Phase B under balanced sinusoidal excitation for healthy and ITSC conditions. The blue curve corresponds to the healthy machine, while the red curve represents the inter-turn short circuit. Under fault conditions, the induced voltage in Phase B collapses dramatically, indicating strong suppression of mutual magnetic coupling. This behavior is a clear magnetic signature of ITSC faults and cannot be explained by electrical impedance effects alone.
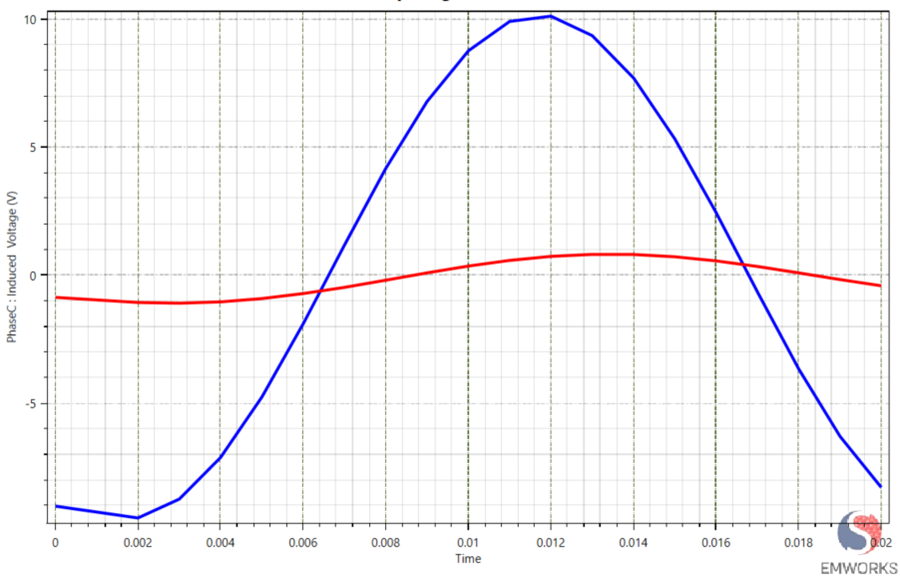
Figure 10 shows the Induced voltage in Phase C under balanced sinusoidal excitation for healthy and ITSC conditions. The blue curve corresponds to the healthy machine, while the red curve represents the inter-turn short circuit. Under fault conditions, the induced voltage in Phase C collapses dramatically, indicating strong suppression of mutual magnetic coupling. This behavior is a clear magnetic signature of ITSC faults and cannot be explained by electrical impedance effects alone.
Torque Behavior in Locked-Rotor Conditions
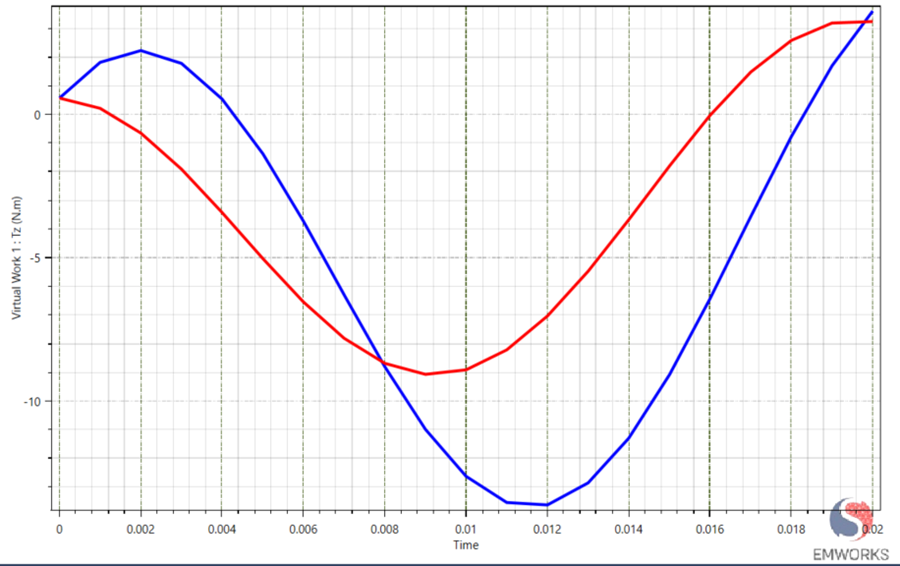
Figure 11 shows the Electromagnetic torque under balanced sinusoidal excitation for healthy(blue curve) and ITSC conditions(red curve). The torque waveform under ITSC conditions shows a clear reduction in peak magnitude along with significant distortion and phase shift compared to the healthy machine. This behavior results from dominant counter-MMF generated by the circulating fault current, which suppresses the normal rotating magnetic field and disrupts mutual inductive coupling. As a result, effective torque production is reduced and oscillatory torque components emerge due to negative-sequence field formation.
Magnetic Flux Distribution


Figure 12 shows the magnetic flux density distribution in the stator core at t = 0.0.1s under healthy operating conditions, where the flux pattern is symmetric and uniformly distributed around the stator circumference, indicating intact mutual magnetic coupling and coherent rotating field formation. Figure 13 shows the corresponding flux distribution under inter-turn short-circuit (ITSC) conditions, characterized by strong spatial asymmetry, localized flux concentration, and flux suppression regions. This transition from a coherent, symmetric flux network to an asymmetric, trapped-flux topology demonstrates the dominance of counter-MMF generated by the circulating fault current in the shorted-turn loop, leading to flux trapping, mutual inductance collapse, and global reconfiguration of the internal magnetic field structure. The comparison directly confirms that the ITSC produces a system-level magnetic topology failure, rather than a localized electrical disturbance.
Engineering Interpretation
The ITSC is not a simple electrical short but a magnetic coupling failure. The shorted-turn loop acts as a parasitic secondary winding that generates dominant counter-MMF, causing mutual inductance collapse and global reconfiguration of the magnetic field structure. This converts a local winding defect into a system-level magnetic failure.
Diagnostic Implications
Current monitoring alone is insufficient for reliable detection of inter-turn short circuits, as ITSCs are magnetically dominated faults rather than purely electrical ones. Effective diagnostics must therefore include magnetic observables in addition to phase currents. High-sensitivity indicators include induced voltage suppression in healthy phases, negative-sequence dominance, torque distortion, and magnetic flux density (B-field) asymmetry. These quantities directly reflect magnetic coupling failure and flux network reconfiguration, providing reliable fault detection that is not masked by operating conditions, control strategies, or load effects.
Conclusion
This study shows that a stator inter-turn short circuit in a PMSM is fundamentally a magnetic system failure, not a localized electrical defect. The shorted turns form a parasitic magnetically coupled loop that generates dominant counter-MMF, leading to mutual inductance collapse, flux suppression, and global reconfiguration of the magnetic field structure. As a result, a local winding fault propagates through the entire electromagnetic system, affecting current distribution, induced voltages, torque production, and field symmetry. ITSCs must therefore be understood, modeled, and diagnosed as magnetic topology failures, not simple electrical short circuits.