Eddy Current Testing
Eddy Current Testing (ECT) is a non-destructive method using electromagnetic induction to detect flaws in materials. A coil powered by AC creates a magnetic field, inducing eddy currents in nearby conductive objects. Flaws in the material alter its electrical conductivity and magnetic permeability, changing the eddy currents and the coil's impedance, thereby revealing defects.
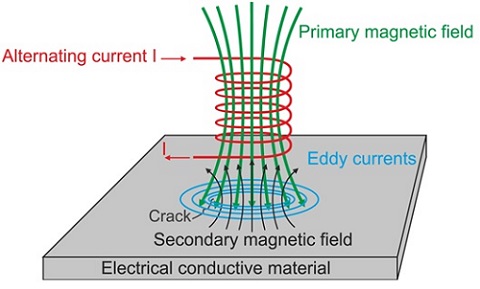
Figure 1 - Eddy Current Testing principle
Problem description
In this example, a conductor plate is scanned by a coil to detect cracks through changes in the coil's impedance. By varying crack sizes and excitation frequencies, the coil's response under different scenarios is studied. The findings from the EMS simulations are confirmed through experimental tests. A 3D model of the probe is simulated using parametric AC magnetic analysis, where the coil's impedance is measured at various positions across the plate, moving in steps of 2 mm. This approach allows for a detailed examination of how defects affect the electromagnetic properties of the conductor.
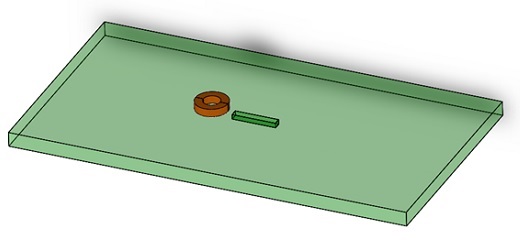
Figure 2 - CAD model of simulated NDT example
Figure 3 shows the geometrical parameters of the model. The crack width and depth are 2mm and 1.3mm respectively. Two different crack lengths have been simulated- 12 mm and 8mm.
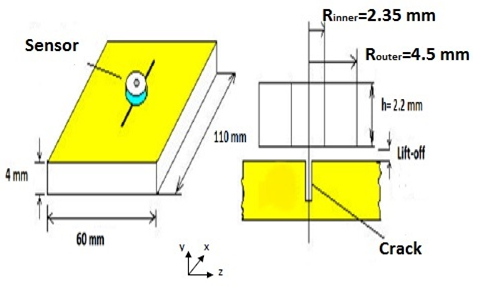
Figure 3 - Geometrical parameters of the model
Study
The EMS AC Magnetic module calculates various outcomes like magnetic flux density, eddy current density, and loss density under sinusoidal excitation. It also provides insights into total eddy current loss, Joule loss, and impedance matrix, among others. For this case, a parametric analysis will chart the coil's impedance at each position.
To conduct an AC Magnetic simulation in EMS, follow these steps:
1. Initiate a new AC Magnetic study.
2. Assign appropriate materials to the parts involved.
3. Set up a suitable coil, driven by either voltage or current, with accurate excitation settings.
4. Proceed to mesh the model and run the simulation.
These steps ensure a systematic approach to analyzing the electromagnetic behavior of the setup under various conditions.
Materials
Both the coil and the plate are made of copper. Below are the properties of the copper and the air surrounding the plate and coil.
Table 1 - Copper properties
| Relative permeability | Electrical conductivity S/m | |
| Copper | 1 | 58.100e+6 |
| Air | 1 | 0 |
Coil
The sensor here is the coil. Table 2 contains the coil properties.
Table 2 - Coil properties
| Number of turns | Current magnitude | |
| Wound Coil | 170 | 20 mA |
Mesh
Meshing is crucial for the accuracy and speed of Finite Element Method (FEM) simulations. Finer meshes increase accuracy but require more computing time, whereas coarser meshes reduce both accuracy and computing time. EMS allows for automatic mesh generation and offers mesh control options for precise adjustments on specific areas. In this example, the area around the coil and the crack air space are finely meshed to a maximum element size of 0.1mm to optimize accuracy. The final mesh is displayed in Figure 4.
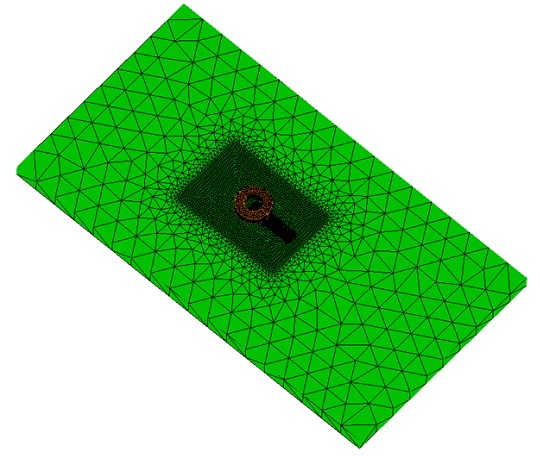
Figure 4 - Meshed Model
EMS results
After conducting a parameterized simulation featuring a 12mm crack length, a coil lift-off distance of 0.13 mm, and an excitation frequency of 50 kHz, the results have been compiled. EMS's parametric analysis feature enables sweeping through a range of either geometrical or simulation parameters, such as current, number of turns, frequency, and mesh size, allowing for comprehensive scenario analysis within a single study.
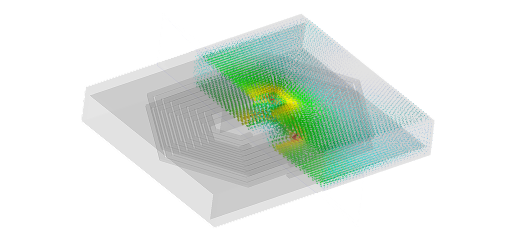
Figure 5 illustrates the current density distribution in the model without a crack, where eddy currents are primarily concentrated within the skin depth. Conversely, Figure 6 reveals the current density distribution when the coil is positioned directly above the crack's center, indicating how the presence of a crack affects the flow of eddy currents.

Figure 5 - Current density distribution in case of plate without crack
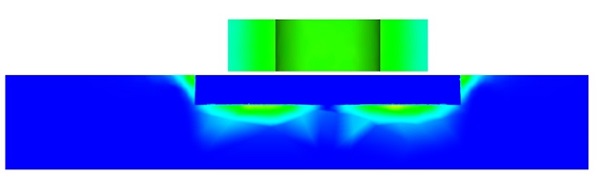
Figure 6 - Current density distribution in case of plate with crack
The coil scans the plate along the crack length, utilizing symmetry to reduce the simulation scope—only half of the coil positions, from the crack's center to its end, are simulated. At each step, the coil's impedance is measured. Figure 7 highlights that impedance peaks at the crack's center. Figure 8 compares EMS simulation results with experimental data [1], showing a close alignment between simulated outcomes and actual measurements, demonstrating the accuracy of the EMS simulations in replicating real-world conditions.
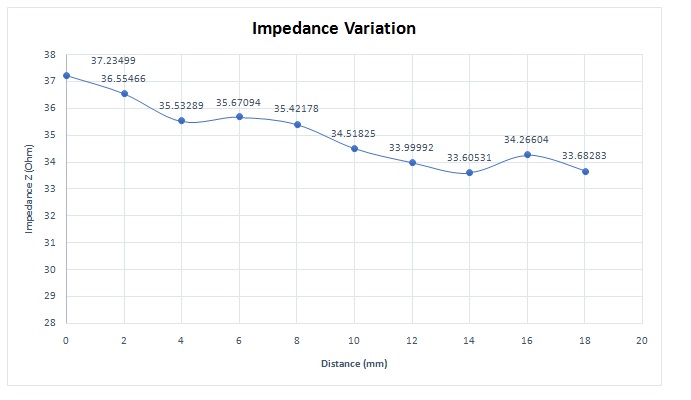
Figure 7 - Impedance variation of coil sensor
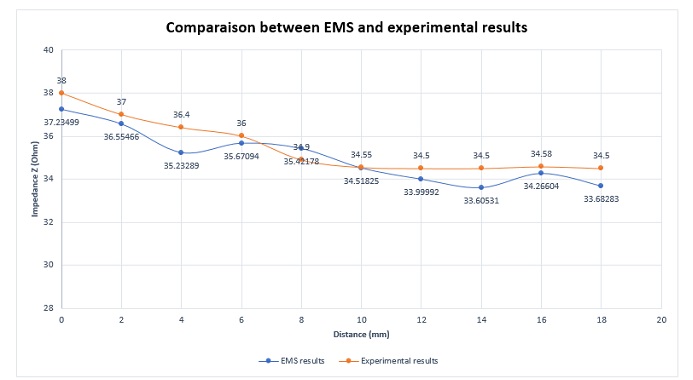
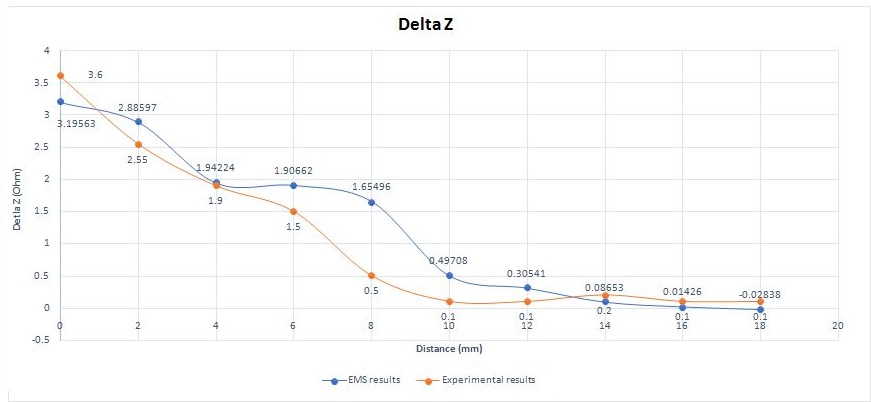
Figure 9 shows the absolute change in the impedance of EMS and experimental tests. It can be calculated as shown in the formula below:
![]()
Relation between crack dimensions and captured signal
The size of the crack significantly influences the impedance behavior as the sensor scans the material. Figure 10 illustrates how impedance variation compares across two different crack lengths, clearly demonstrating that larger cracks lead to more substantial changes in impedance. This increased variation with longer cracks makes them easier to detect, emphasizing the impact of crack size on the effectiveness of eddy current testing (ECT) for identifying material flaws.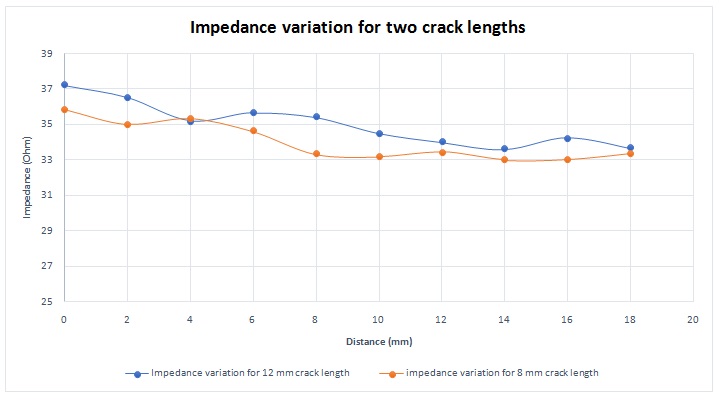
Figure 10 - Impedance variation for different crack lengths
EMS simulation results match very well the experimental results as shown in figure 11.
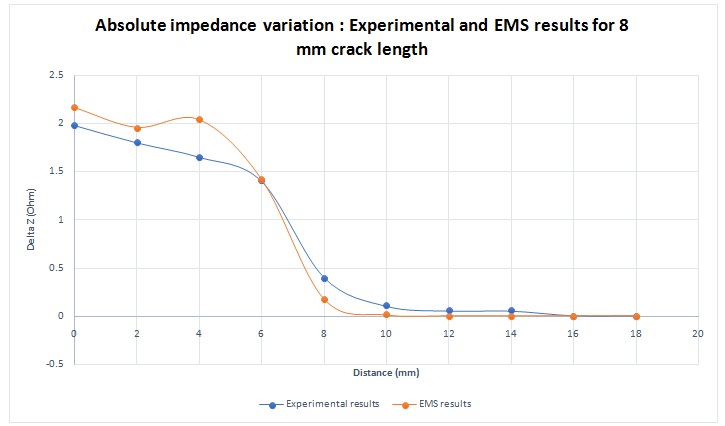
Figure 11 - Absolute impedance variation for 8 mm crack length
Relation between excitation frequency and captured signal
The effectiveness of crack detection with an eddy current testing (ECT) coil is notably influenced by the excitation frequency, with higher frequencies making it easier to identify cracks. This is supported by both EMS simulations and experimental data, as highlighted in Figure 12. The principle underlying this observation relates to the skin depth, which determines how deep into the material the eddy currents can penetrate. The skin depth (
) is governed by the formula:
where:
- is the frequency of the excitation signal,
- is the conductivity of the material,
- is the permeability of the material.
The formula illustrates that skin depth decreases as the frequency increases, meaning higher frequencies result in eddy currents that are confined to a thinner surface layer. This concentration of eddy currents near the surface leads to a stronger magnetic flux that more significantly influences the probe, enhancing crack detectability. The consistent alignment between EMS calculations and measured data further validates this frequency-dependent behavior in crack detection efficacy.
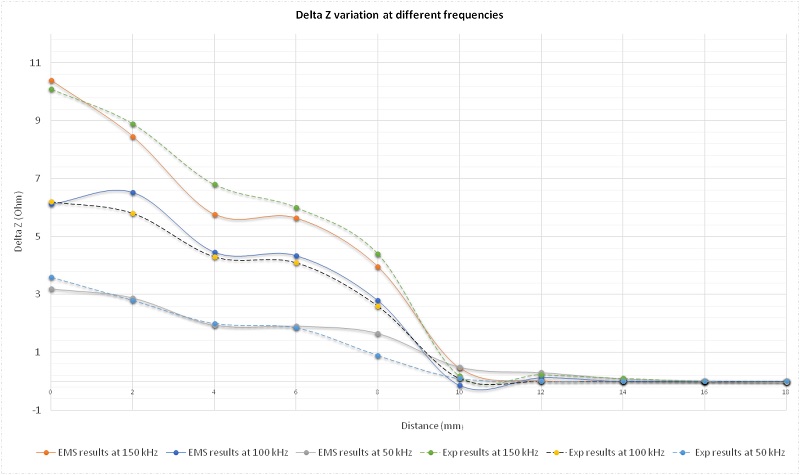
Figure 12 - EMS and Experimental results of absolute impedance variation at different frequencies
Relation between lift-off distance and captured signal
The distance between the coil sensor and the specimen surface, known as the lift-off, plays a vital role in the accuracy of crack detection. As demonstrated in Figure 13, the variation in absolute impedance becomes more pronounced with a smaller lift-off. This effect underscores the sensitivity of eddy current testing to the proximity between the sensor and the material being inspected. A closer distance allows for a stronger interaction between the induced eddy currents and the coil, making variations due to flaws like cracks more detectable. This principle highlights the importance of minimizing lift-off to enhance the detection capabilities of eddy current testing methods.
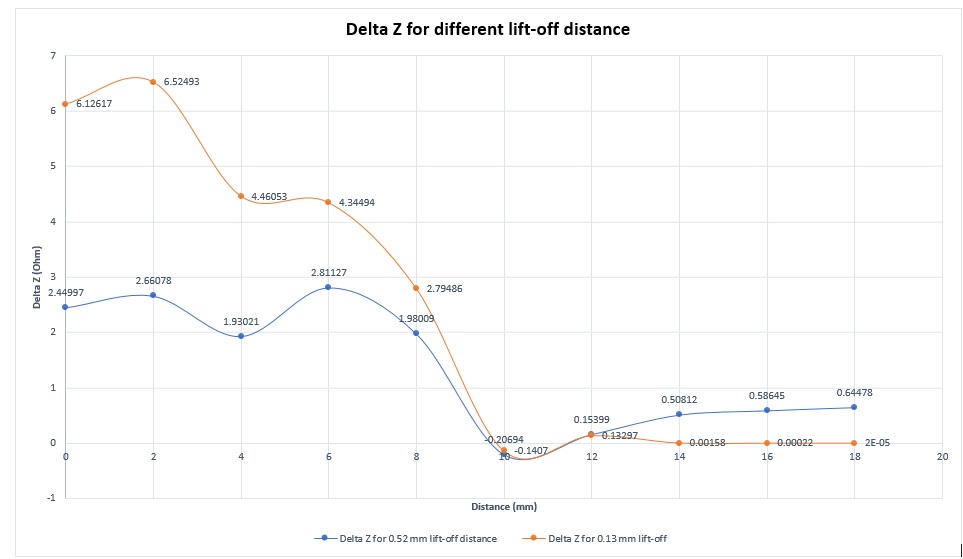
Figure 13 - EMS results of absolute impedance variation for different lift-off distance
Eddy Current Testing (ECT) emerges as a sophisticated non-destructive testing method that harnesses electromagnetic induction to unveil hidden flaws within conductive materials. This application note meticulously elucidates the principles and processes of ECT, demonstrating its effectiveness in crack detection through variations in electrical conductivity and magnetic permeability. By examining factors such as crack size, excitation frequency, and coil lift-off distance, the note provides a comprehensive understanding of how these elements influence ECT's sensitivity and accuracy. Supported by EMS simulations and experimental validations, the findings offer invaluable insights for enhancing material inspections, underscoring the pivotal role of ECT in advancing quality assurance and safety in various industries.
Reference
[1]:Hamel Meziane.2012. Etude et réalisation d ‘un dispositive de détection de défaut par méthodes électromagnétiques.