| Alternating Current Field Measurement
Alternating current field measurement (ACFM) is an electromagnetic technique that permits non-destructive detection and size estimation of cracks extending to the surface of ferrous and non-ferrous metals. The ACFM probe (Figure 1) contains two coils and a magnetic sensor packaged inside a container. The container is made of plastic (a non-magnetic material). The magnetic sensor can detect the value of the magnetic flux density when the probe is kept in contact with the test surface. It is typically scanned along the direction shown in Figure 1. The AC Magnetic module of EMS coupled to motion analysis is used to study this example.
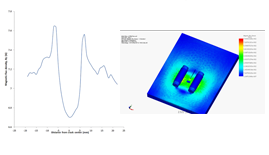
The magnetic flux density in the Y direction (By) is measured by the sensor. When there is no crack, the value of (By) is more or less uniform but when a surface crack is detected, the value of (By) changes. Figure 2 shows the computed (By) using EMS ; it shows two peak values in the extremity points of the crack (due to the action of point) and a fall down along the crack. Figure 3 illustrates a 3D plot of magnetic flux density of the simulated model.
Dielectric Resonator Filter
A symmetric model of a dielectric resonator filter (Figure 4) is analyzed using the Scattering parameters module of HFWorks to determine its pass-band, the attenuation in and out of the band, and the electric field distributions for various frequencies. The results show perfect match with those measured. The cables have a lossy conductor, and have a Teflon inside part. HFWorks gives the possibility to plot various Scattering Parameters on 2D and Smith Chart plots. Figure 5 shows a 2D plot of insertion loss variation (S21). We notice that we reach great isolation outside the band. The electric field can be spotted in vector and fringe 3D plots for all studied frequencies (Figure 6).
The Scattering Parameters solving might be preceded by a resonance study to make sure that the dimensions of the model fit the desired frequency i.e. the desired resonance mode's.
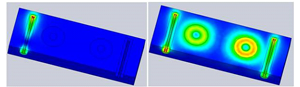
Figure 6: Electric field distribution (at 4 GHz (left) and 4.56 GHz (right)).
Read more
Science News
Stephen Hawking’s Final Theory Tackles the Multiverse
Stephen Hawking may have died on March 14, but he’s still pushing physics forward. Today, the peer-reviewed Journal of High Energy Physics (JHEP) published Hawking’s final theory on the universe’s origin, titled “A Smooth Exit from Eternal Inflation?” The famed physicist wrote the paper in collaboration with Thomas Hertog, a professor at Belgium’s Catholic University of Leuven (KU Leuven), and it presents a multiverse theory unlike any other..
Read full article |
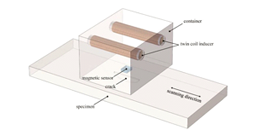
Figure 1: ACFM prob.
|
Figure 2: Variation of the By along the crack size.
|
Figure 3: The magnetic flux density generated by the twin coil.
|
Read more
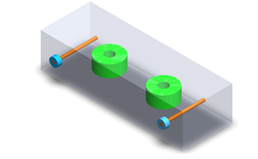
Figure 4: 3D Model of the dielectric resonator filter.
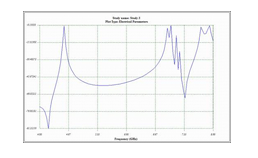
Figure 5: Variations of insertion loss (S21).
Blog Post
Metal Detector Explained
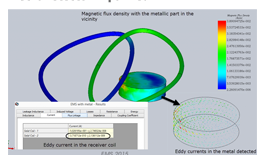
Figure 1: EMS plots with the presence of a metallic part.
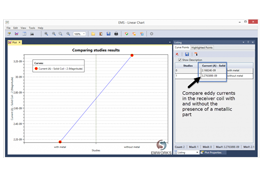
Figure 2: Compare the eddy currents induced in the presence of a metallic part with the ideal case.
Read more |