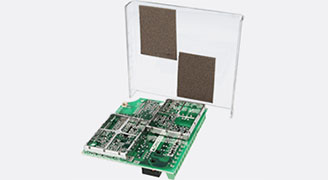
The inductive sensor is responsible to detect the position of a movable target accurately by measuring the change in inductance of a PCB coil. By connecting this coil to an appropriate circuit, one can correlate between the proximity and the inductance measured. EMS is used to compute the inductance of the PCB coil at various positions of the target. This can help the circuit designers to create a circuit that can accurately measure this change in inductance.
Inductive sensors are used commonly for position detection. They consist of a coil which is excited using a high frequency AC current. The basic principle of an inductive sensor is based on Faraday’s law of induction. The amplitude of the current is very low and is of the order of mA. When there is no target, as shown in Figure 1, in the proximity, the inductance of the coil is well known and can be computed by EMS. In case of a target, as shown in Figure 2, directly above the coil, the inductance of the coil changes and this new inductance value helps the sensor to detect a target. This type of sensors only work for targets that are conductors.
Figure 1 - Target not in the direct proximity
Figure 2 - Target directly above the sensor
In EMS, these types of sensors are studied using AC Magnetic simulation. In AC Magnetic simulation, EMS solves the problem in frequency domain and gives the following as the output – Inductance of the coil, Resistance of the coil, Magnetic flux density, Magnetic field intensity and Eddy current density. Since the solution is solved in frequency domain, all the field quantities can be obtained as a function of phase angle.
In this simulation, Figure 3, the frequency of the AC Magnetic study was set to be 1 MHz. EMS can solve up to a frequency of a few hundred megahertz.
The coil is modeled as a Solid Coil. The current in the coil is 1 mA and the direction of the current is shown in Figure 4. EMS can model a coil as both Solid coil and Stranded coil. Solid coil supports eddy current but Stranded coil assumes no eddy currents. In this simulation, the eddy currents in the coil is neglected. But the eddy effects are considered for the movable target material made from copper.
Figure 4 - Current direction in the Solid coil
In this simulation, there are 3 components – the coil and the target are made of Copper and the Air region is Air as the name suggests. Figure 5 shows the various parts modeled for this simulation. The Air region is an important part of any EM simulation performed using EMS. It helps you to get the field quantities in the air space around the coil and the target. EMS comes with a fully customizable material library that contains hundreds of commonly used materials in Electrical Engineering.
EMS comes with a fully automatic mesh generator which considers the precise geometry created in your CAD system. This obviates the need to change or modify your CAD geometry in any way. To capture the skin depth in the target, we apply a mesh control on the target. Mesh control allows users to selectively target regions in the model and specify a mesh size. Figure 6 shows the mesh generated by EMS.
The Results section is divided into 3 parts –
The coil inductance is useful because the engineer uses this value to design a circuit that can detect the motion. The table below as shown in Figure 7, shows the inductance of the coil at the 2 positions – when the target is approaching the coil but is not in the vicinity and when the target is directly on top of the coil. The inductance reduces when the target is in the proximity of the coil from 1.27 micro Henry to 1.07 micro Henry. This amounts to a 15.7% reduction in the inductance of the coil. These values help an engineer to design a circuit that is sensitive enough to capture this difference.
Figure 7- Inductance comparison between the 2 positions
The resistance of the coil is its intrinsic property and doesn’t change with the position of the target. EMS computes the coil resistance based on its precise geometry. The resistance of the coil is computed to be 0.35 Ohms as shown in Figure 8. Note that this resistance is the DC resistance of the coil.
Figure 8- EMS computes the DC resistance of the coil
Figures 9 and 10 show the magnetic field density and magnetic field intensity plots for position 2 (when the target is in the proximity). Notice that for the magnetic flux density vector plots the size of the vectors passing through the target is smaller and that is because of induced eddy currents on the target. The eddy currents on the target opposes the field generated by the coil. EMS can create 3D plots, Vector plots and Section plots. Some of these plots help you to visualize your fields closely and understand what happens in various situations.
Figure 9- Vector plot of the magnetic flux density
Figure 10- Section plot of the Magnetic Field Intensity
Figure 11 shows the distribution of the eddy currents in the target when it is in the proximity of the sensor (or the coil). Notice how the vectors of the current create a flux that opposes the flux created by the coil.
Figure 11- Eddy currents in the target
This example explains how EMS can help engineers design better inductive sensors. The main parameter they are looking for is the change in inductance which helps them design a sensitive circuit that can capture this change. The field plots give a wealth of information by which they can study the designs closely especially with respect to the behavior of the fields.