.jpg)
Figure 1 - RF Tunable filter configuration
To thoroughly explore the performance of each filter configuration, we will conduct a series of Scattering Parameter (S-parameter) simulations across a specified frequency range of 6 to 7 GHz. For these simulations, two approaches can be employed: the fast sweep plan, which focuses on a central frequency for quicker results, and the discrete frequencies plan, which offers higher precision by examining specific frequencies within the range.
The filter's design incorporates a Perfect Electric Conductor (PEC) material on the lateral surfaces of the waveguide. This choice of material ensures that the electromagnetic fields are properly confined within the waveguide structure, mimicking ideal conducting conditions for accurate simulation results.
To accurately capture the effects of the tuning screws on the filter's performance, the meshing strategy is carefully designed. As we approach the location of each screw, the mesh element size is reduced. This refinement is critical for ensuring that the local changes in geometry due to the screw adjustments are accurately represented in the simulation, thereby improving the fidelity of the results.
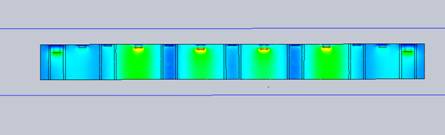
At the user-defined center frequency, it is possible to visualize both the electric and magnetic fields within and outside the model. This visualization provides insight into how the fields interact with the structure of the filter, including the effects of the tuning screws. An animation demonstrates the propagation of the electromagnetic wave from the input to the output at 6.6 GHz, offering a dynamic view of the filter's performance and the wave's behavior throughout the waveguide. This visual representation is invaluable for understanding the operational characteristics of the filter at the specified frequency.
Figure 2 - 3D wave propagation in the filter
Utilizing the section clipping feature enhances our ability to closely examine the electric field distribution surrounding each tuning screw and within the waveguide itself. This advanced visualization tool allows us to selectively cut through the model, providing a clear window into the internal field dynamics that are otherwise obscured in a full 3D representation. By strategically applying section clips, we can isolate and scrutinize the immediate effects of each screw's adjustment on the electric field distribution. This technique is particularly useful for identifying how modifications to screw depth and position influence the overall performance of the filter by altering the path and intensity of the electric fields. Such detailed insights are crucial for optimizing the filter design, ensuring that it meets the desired specifications by precisely controlling the electromagnetic interactions within the waveguide.
The results from various simulations can be aggregated into a single plot, which displays how different configurations impact the filter's performance. This concise visualization allows designers to quickly identify the configuration that best meets their criteria, streamlining the decision-making process and highlighting the most effective design solutions based on empirical data.
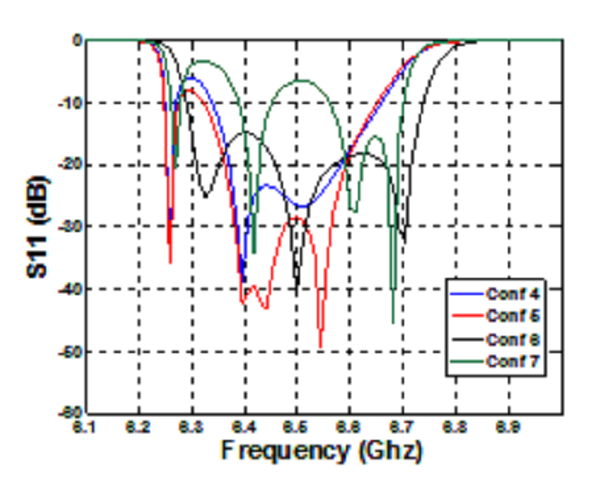
Figure 3 - Return Loss of the filter within various configurations
Crucially, the plot enables us to examine the filter's frequency response, particularly its band-pass characteristics, across various screw configurations (S1-S13). From this analysis, it becomes evident that adjustments to the screws' dimensions significantly influence the filter's matching. This insight is derived from observing how each configuration affects the filter's ability to pass certain frequency ranges while blocking others, thereby optimizing its performance for the intended application.
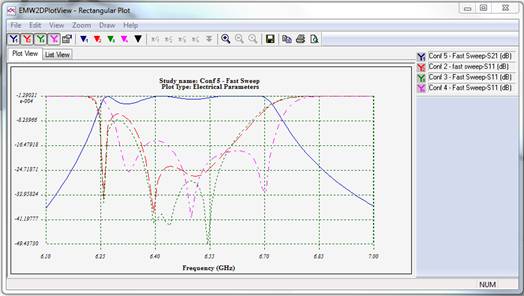
Figure 4 - Scattering Parameters' Variations of the filter for different configurations
The application note presents a methodology for designing RF filters with tunable characteristics, focusing on adjusting screw configurations within a waveguide to modify the filter's frequency response. By varying the depth of screws while keeping their diameters and positions constant, precise control over the filter's performance is achieved without extensive structural changes. Through detailed simulations using Scattering Parameter analysis, the effects of different screw configurations on the filter's behavior are thoroughly explored. Visualization tools, including section clipping and 3D wave propagation animations, offer insights into the electric field distribution and wave behavior within the waveguide. By aggregating simulation results into concise plots, designers can efficiently identify optimal configurations that meet desired specifications. This tunable approach provides flexibility and efficiency in achieving desired filter performance outcomes, demonstrating the effectiveness of incremental adjustments in filter design optimization.
| Share on |